Economy
How Much Land does the U.S. Military Control in Each State?


How Much Land does the U.S. Military Own in Each State?
The United States spends an unparalleled amount of money on its military—about $778 billion each year to be precise.
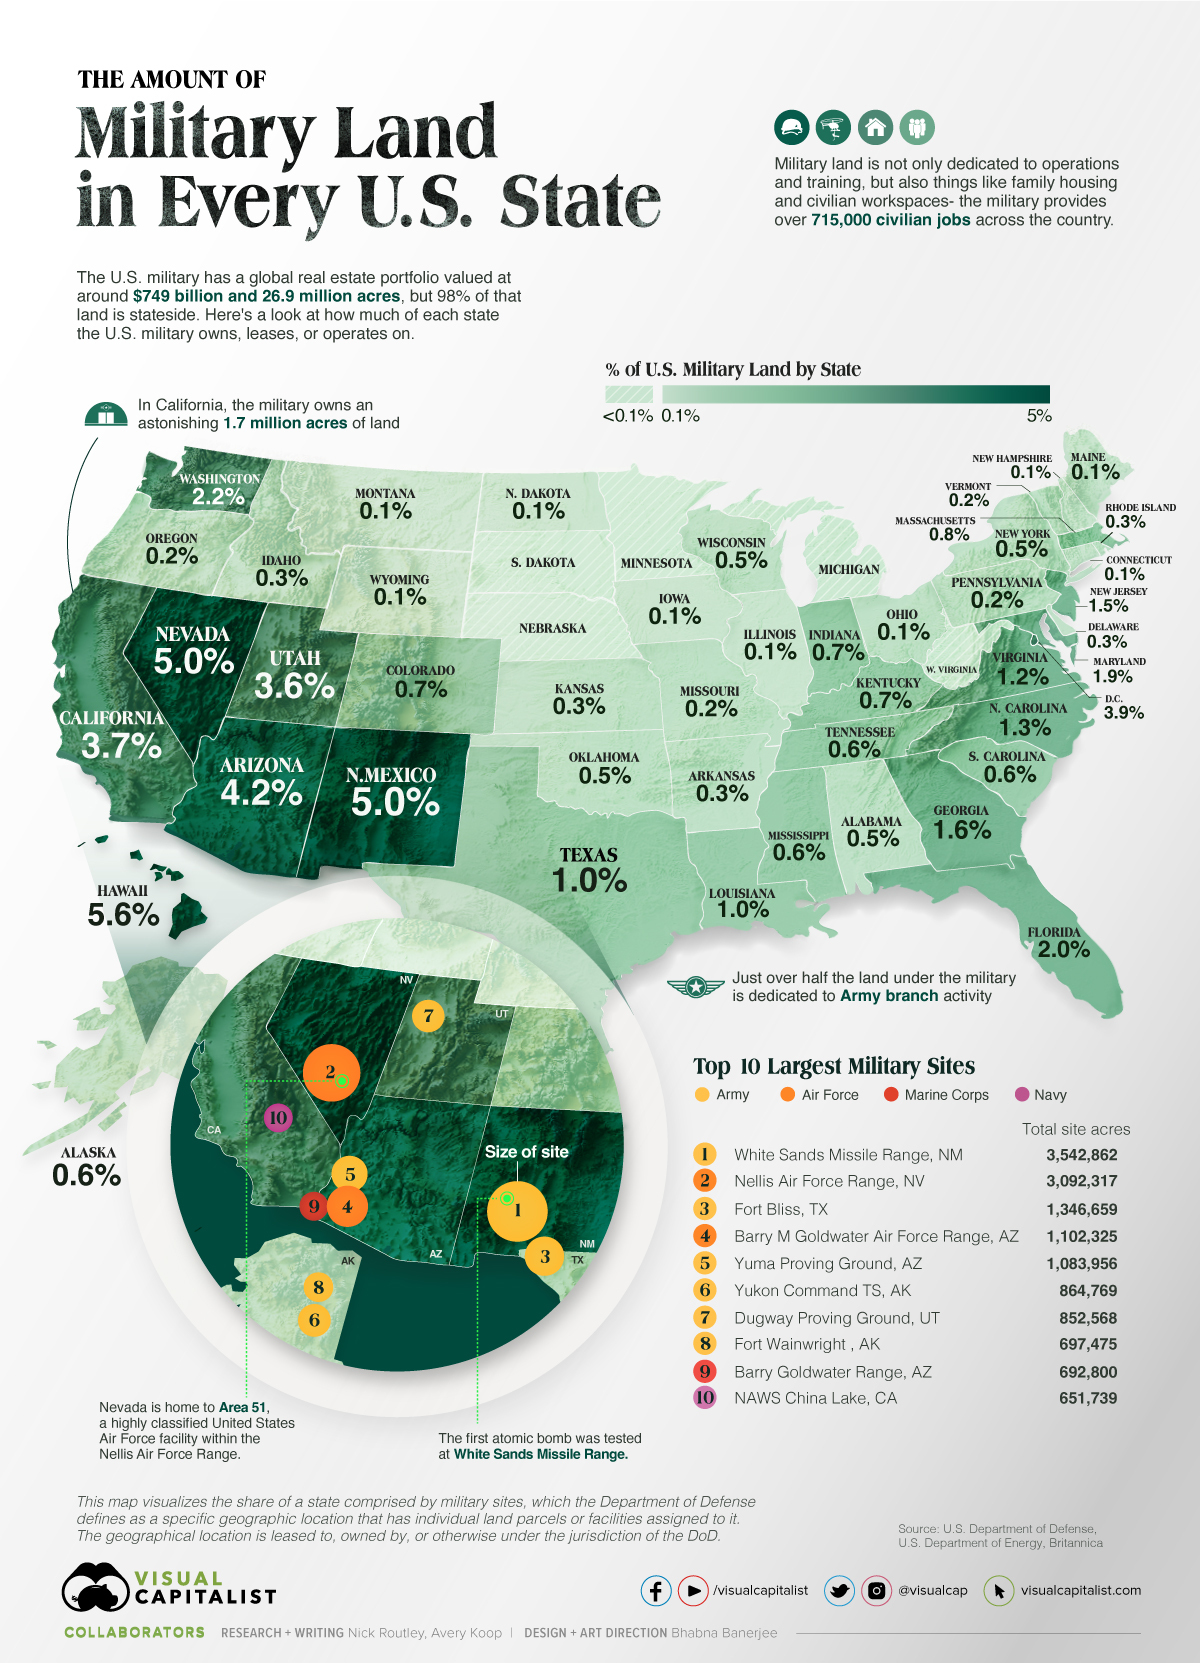
Additionally, the U.S. military also owns, leases, or operates an impressive real estate portfolio with buildings valued at $749 billion and a land area of 26.9 million acres, of which around 98% is located within the United States.
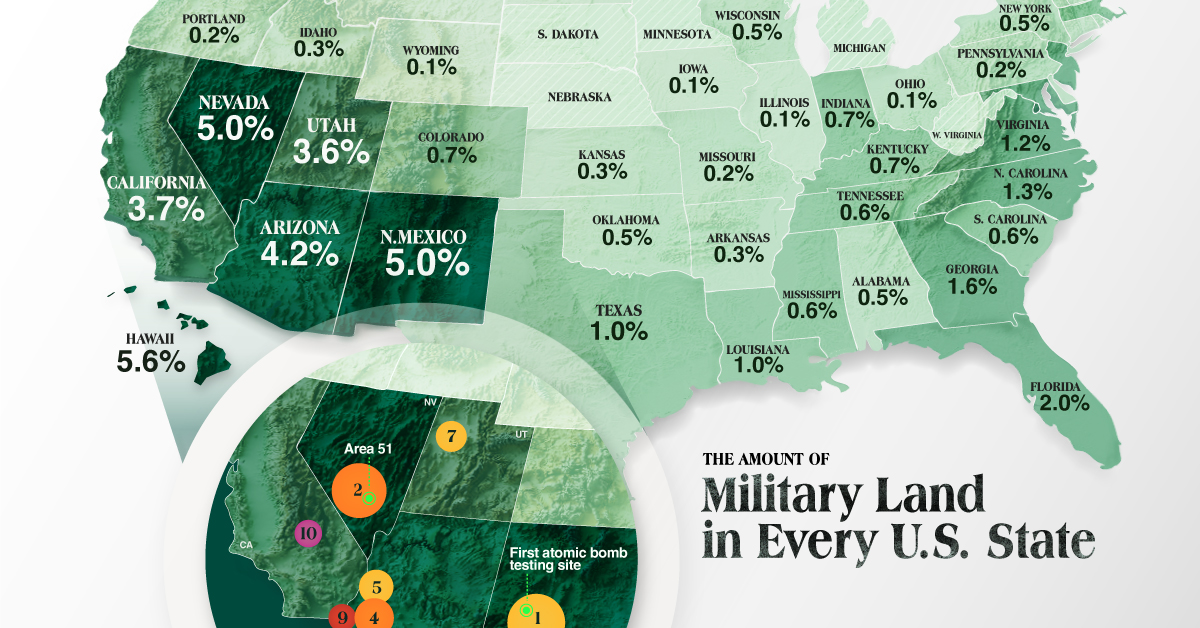
This visual, using data from the Department of Defense (DoD) reveals how much of each state the U.S. military owns, leases, or operates on.
This map visualizes the share of a state comprised by military sites, which the Department of Defense defines as a specific geographic location that has individual land parcels or facilities assigned to it. The geographical location is leased to, owned by, or otherwise under the jurisdiction of the DoD.
What is Military Land Used For?
The DoD is the larger government umbrella under which the military falls and the department operates on over 26 million acres of land stateside.
To further break it down the U.S. military is divided into four main branches:
- Army
- Navy
- Air Force
- Marine Corps
There is also the Space Force, the Coast Guard, and the National Guard. However, most of the land is dedicated to the Army, which is the military’s largest branch.
Military bases are used for training and housing soldiers, testing weapons and equipment, conducting research, and running active operations, among other things. A large majority of the square footage is actually designated for family housing.
For example, Fort Bragg, North Carolina, which is one of the most famous U.S. Army bases, is home to more than 260,000 people including the families of soldiers. The base, which is virtually its own city, is the largest U.S. Army installation with 53,700 troops—nearly 10% of the Army—and over 14,000 civilian employees.
Which States Have the Biggest Military Presence?
Looking at the largest total sites, the top 10 combined cover an astonishing 13,927,470 acres, larger than 10 individual states including New Jersey, Massachusetts, and Hawaii.
Here’s a look at the size of the military’s sites in each state and how much of that state’s land the sites take up:
| State | Site (Acres) | Share of State's Total Land |
|---|---|---|
| Hawaii | 228,639 | 5.6% |
| Nevada | 3,541,949 | 5.0% |
| New Mexico | 3,889,638 | 5.0% |
| Arizona | 3,042,028 | 4.2% |
| District of Columbia | 1,525 | 3.9% |
| California | 3,655,180 | 3.7% |
| Utah | 1,883,234 | 3.6% |
| Washington | 941,146 | 2.2% |
| Florida | 690,994 | 2.0% |
| Maryland | 115,158 | 1.9% |
| Georgia | 589,060 | 1.6% |
| New Jersey | 71,822 | 1.5% |
| North Carolina | 411,152 | 1.3% |
| Virginia | 289,815 | 1.2% |
| Texas | 1,690,725 | 1.0% |
| Louisiana | 272,357 | 1.0% |
| Massachusetts | 39,107 | 0.8% |
| Colorado | 476,056 | 0.7% |
| Kentucky | 180,852 | 0.7% |
| Indiana | 160,103 | 0.7% |
| Mississippi | 176,745 | 0.6% |
| South Carolina | 109,938 | 0.6% |
| Alaska | 2,057,351 | 0.6% |
| Tennessee | 147,839 | 0.6% |
| Alabama | 166,800 | 0.5% |
| Oklahoma | 223,632 | 0.5% |
| New York | 152,611 | 0.5% |
| Wisconsin | 155,500 | 0.5% |
| Rhode Island | 2,280 | 0.3% |
| Delaware | 4,170 | 0.3% |
| Kansas | 140,973 | 0.3% |
| Arkansas | 88,072 | 0.3% |
| Idaho | 136,350 | 0.3% |
| Oregon | 140,294 | 0.2% |
| Pennsylvania | 61,323 | 0.2% |
| Missouri | 88,240 | 0.2% |
| Vermont | 1,1520 | 0.2% |
| Ohio | 35,150 | 0.1% |
| Maine | 18,742 | 0.1% |
| Illinois | 31,165 | 0.1% |
| North Dakota | 31,937 | 0.1% |
| Iowa | 24,506 | 0.1% |
| Montana | 56,998 | 0.1% |
| Connecticut | 1,753 | 0.1% |
| New Hampshire | 3,225 | 0.1% |
| Wyoming | 31,984 | 0.1% |
| Nebraska | 21,272 | 0.04% |
| Michigan | 14,004 | 0.04% |
| West Virginia | 3,084 | 0.02% |
| South Dakota | 9,681 | 0.02% |
| Minnesota | 2,736 | 0.01% |
In Hawaii, 5.6% of the state belongs to the military. The historic Pearl Harbor on the island of Oahu is still an active base, housing both the Navy and the Air Force.
In the nation’s capital, Washington D.C., 3.9% of the small district is owned or operated on by the military—there are approximately 18 independent sites in the city.
Most of the DoD’s land is in the southwestern United States. One major benefit is that there are areas large enough in these states to test hugely destructive weapons without harming anyone. The atomic bomb was first detonated in the middle of nowhere in New Mexico at the White Sands Missile Range, the biggest military site in the country.
Almost all of the largest military sites fall under the Army branch, which has over 415,000 active personnel. Here’s a look at the U.S. military breakdown in terms of population:
- Active Duty:
- Army: 415,967
- Navy: 304,118
- Marine Corps: 146,728
- Air Force (also includes Space Force): 273,983
- Coast Guard: 38,829
- Reserves: 438,645
Beyond just the presence of soldiers across the states, the military also represents a lot of jobs. In total, both on U.S. soil and globally the DoD provides nearly 2.9 million jobs from active duty troops to civilian positions within the military. In California, for example, the military provides over 62,000 civilian jobs.
U.S. Military Presence Beyond its Borders
When it comes to all the land that the military both owns and leases globally, the figure is huge, coming out to 26.9 million acres. The Army controls 51% of the DoD’s land, followed by the Air Force’s 32%.
Military land owned by the DoD can be found outside the U.S. in 8 territories and 45 foreign countries. Here’s a breakdown of where the majority of the U.S.’ foreign bases are:
- 🇩🇪 Germany: 194 sites
- 🇯🇵 Japan: 121 sites
- 🇰🇷 South Korea: 83 sites
In places where there are ongoing conflicts, the U.S. has a few permanent forces. In regular times in Ukraine, there are 23 active duty soldiers permanently stationed. In Russia there are 41 active duty U.S. troops. However, President Joe Biden has recently announced that he will increase the U.S.’ military presence across Europe because of the war in Ukraine.


Markets
Ranked: The Largest U.S. Corporations by Number of Employees
We visualized the top U.S. companies by employees, revealing the massive scale of retailers like Walmart, Target, and Home Depot.


The Largest U.S. Corporations by Number of Employees
This was originally posted on our Voronoi app. Download the app for free on Apple or Android and discover incredible data-driven charts from a variety of trusted sources.
Revenue and profit are common measures for measuring the size of a business, but what about employee headcount?
To see how big companies have become from a human perspective, we’ve visualized the top U.S. companies by employees. These figures come from companiesmarketcap.com, and were accessed in March 2024. Note that this ranking includes publicly-traded companies only.
Data and Highlights
The data we used to create this list of largest U.S. corporations by number of employees can be found in the table below.
| Company | Sector | Number of Employees |
|---|---|---|
| Walmart | Consumer Staples | 2,100,000 |
| Amazon | Consumer Discretionary | 1,500,000 |
| UPS | Industrials | 500,000 |
| Home Depot | Consumer Discretionary | 470,000 |
| Concentrix | Information Technology | 440,000 |
| Target | Consumer Staples | 440,000 |
| Kroger | Consumer Staples | 430,000 |
| UnitedHealth | Health Care | 400,000 |
| Berkshire Hathaway | Financials | 383,000 |
| Starbucks | Consumer Discretionary | 381,000 |
| Marriott International | Consumer Discretionary | 377,000 |
| Cognizant | Information Technology | 346,600 |
Retail and Logistics Top the List
Companies like Walmart, Target, and Kroger have a massive headcount due to having many locations spread across the country, which require everything from cashiers to IT professionals.
Moving goods around the world is also highly labor intensive, explaining why UPS has half a million employees globally.
Below the Radar?
Two companies that rank among the largest U.S. corporations by employees which may be less familiar to the public include Concentrix and Cognizant. Both of these companies are B2B brands, meaning they primarily work with other companies rather than consumers. This contrasts with brands like Amazon or Home Depot, which are much more visible among average consumers.
A Note on Berkshire Hathaway
Warren Buffett’s company doesn’t directly employ 383,000 people. This headcount actually includes the employees of the firm’s many subsidiaries, such as GEICO (insurance), Dairy Queen (retail), and Duracell (batteries).
If you’re curious to see how Buffett’s empire has grown over the years, check out this animated graphic that visualizes the growth of Berkshire Hathaway’s portfolio from 1994 to 2022.

-

 Technology2 weeks ago
Ranked: The Most Popular Smartphone Brands in the U.S.
-

 Automotive1 week ago
Almost Every EV Stock is Down After Q1 2024
-

 Money1 week ago
Where Does One U.S. Tax Dollar Go?
-

 Green2 weeks ago
Ranked: Top Countries by Total Forest Loss Since 2001
-

 Real Estate2 weeks ago
Visualizing America’s Shortage of Affordable Homes
-

 Maps2 weeks ago
Mapped: Average Wages Across Europe
-

 Mining2 weeks ago
Charted: The Value Gap Between the Gold Price and Gold Miners
-

 Demographics2 weeks ago
Visualizing the Size of the Global Senior Population