Markets
Visualizing the Countries With the Highest Corporate Tax Rates
Article/Editing:
![]() See this visualization first on the Voronoi app.
See this visualization first on the Voronoi app.
Countries With the Highest Corporate Tax Rate Around the World
This was originally posted on our Voronoi app. Download the app for free on iOS or Android and discover incredible data-driven charts from a variety of trusted sources.
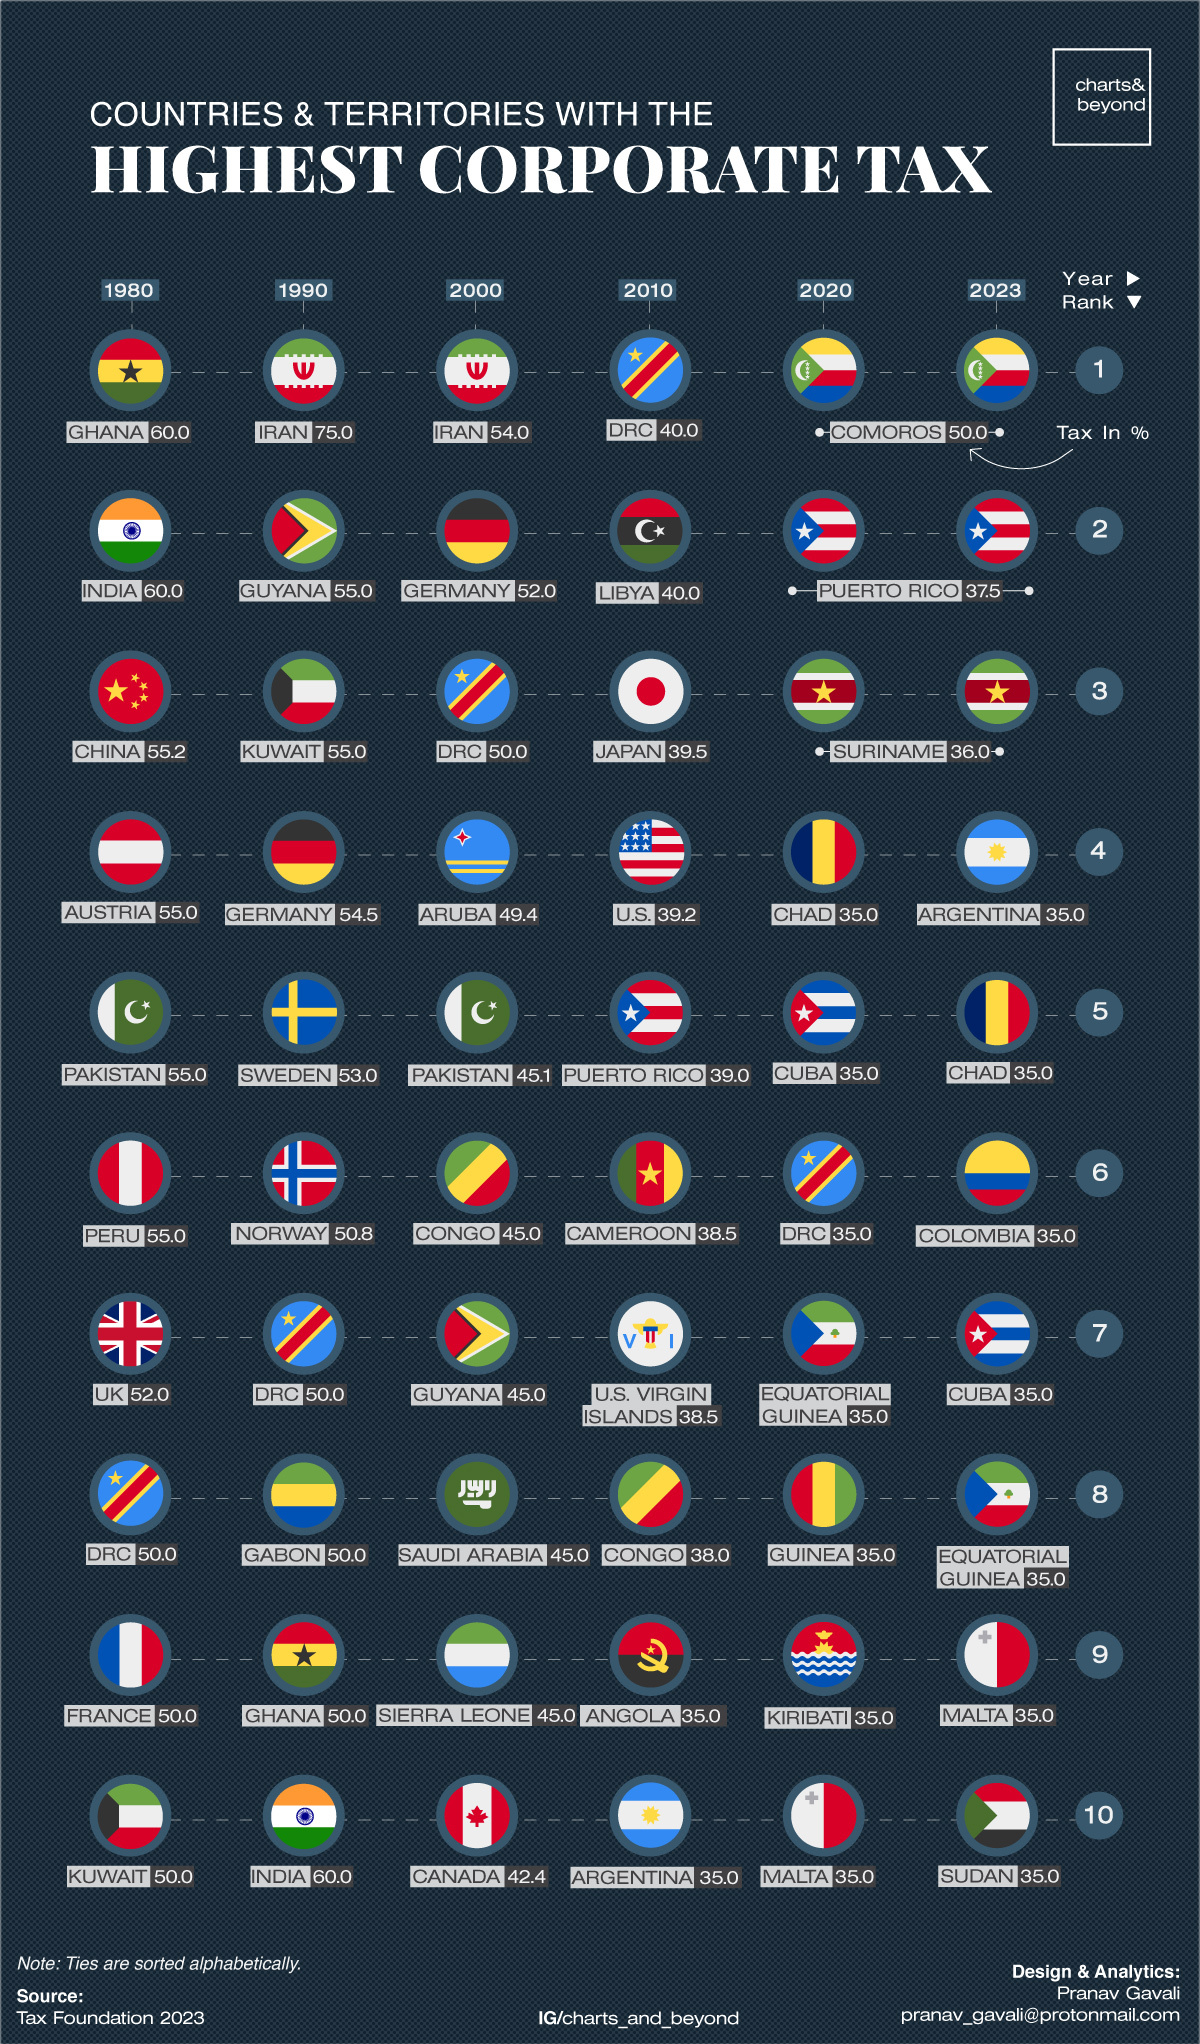
In 1980, the global average corporate tax rate stood at 40.2%—a level notably higher than today.
Over the last several decades, corporate tax rates have declined across every region, with the average now falling at 23.5% as of 2023. As tax rates have sunk lower, U.S. Treasury Secretary Janet Yellen and others have called for a global minimum corporate tax to prevent multinationals from sheltering profits in tax havens.
But on the other hand, some argue that lower corporate rates allow corporations to report more income and boost real business activities.
The above graphic, from Pranav Gavali, shows the countries with the highest corporate tax rates since 1980.
What are the Top 10 Countries by Corporate Tax Rates?
Below, we show how countries with the highest corporate taxes have changed over the last four decades, based on data from the Tax Foundation:
| Rank | Country | Corporate Tax Rate 2023 | Country | Corporate Tax Rate 1980 |
|---|---|---|---|---|
| 1 | 🇰🇲 Comoros | 50.0% | 🇬🇭 Ghana | 60.0% |
| 2 | 🇵🇷 Puerto Rico | 37.5% | 🇮🇳 India | 60.0% |
| 3 | 🇸🇷 Suriname | 36.0% | 🇨🇳 China | 55.2% |
| 4 | 🇦🇷 Argentina | 35.0% | 🇵🇰 Pakistan | 55.0% |
| 5 | 🇹🇩 Chad | 35.0% | 🇵🇪 Peru | 55.0% |
| 6 | 🇨🇴 Colombia | 35.0% | 🇦🇹 Austria | 55.0% |
| 7 | 🇨🇺 Cuba | 35.0% | 🇬🇧 United Kingdom | 52.0% |
| 8 | 🇬🇶 Equatorial Guinea | 35.0% | 🇨🇩 DRC | 50.0% |
| 9 | 🇲🇹 Malta | 35.0% | 🇫🇷 France | 50.0% |
| 10 | 🇸🇩 Sudan | 35.0% | 🇰🇼 Kuwait | 50.0% |
As the above table shows, countries clustered in Africa and South America have the top rates globally.
Argentina, with a corporate tax rate of 35%, hiked up rates from 25% in 2022 as the country was mired in a deepening economic crisis. The country has also been a key supporter of a global minimum tax, suggesting it should be raised as high as 25%.
Malta, the only European nation on the list, also has one of the highest rates. Yet its tax system is complex: local businesses pay a 35% rate on profits, but international firms can pay as low as 5% in Malta with an additional 10% tax paid in their originating country.
By contrast, we can see that in 1980, countries including India, China and the United Kingdom had corporate tax rates above 50%. Since then, China underwent a series of economic reforms that included key tax reductions that helped drive the growth of its private sector.
In the United Kingdom, tax rates were 52% four decades ago and now fall at 25%. The U.S. tells a similar story, with corporate rates standing at 46% in 1980—more than double the rates seen today. Major corporate tax cuts were seen during Reagan’s presidency during the 1980s, when rates were cut to 35%, and later in 2017 when they were further reduced to 21% under the Tax Cuts and Jobs Act.

This article was published as a part of Visual Capitalist's Creator Program, which features data-driven visuals from some of our favorite Creators around the world.


Markets
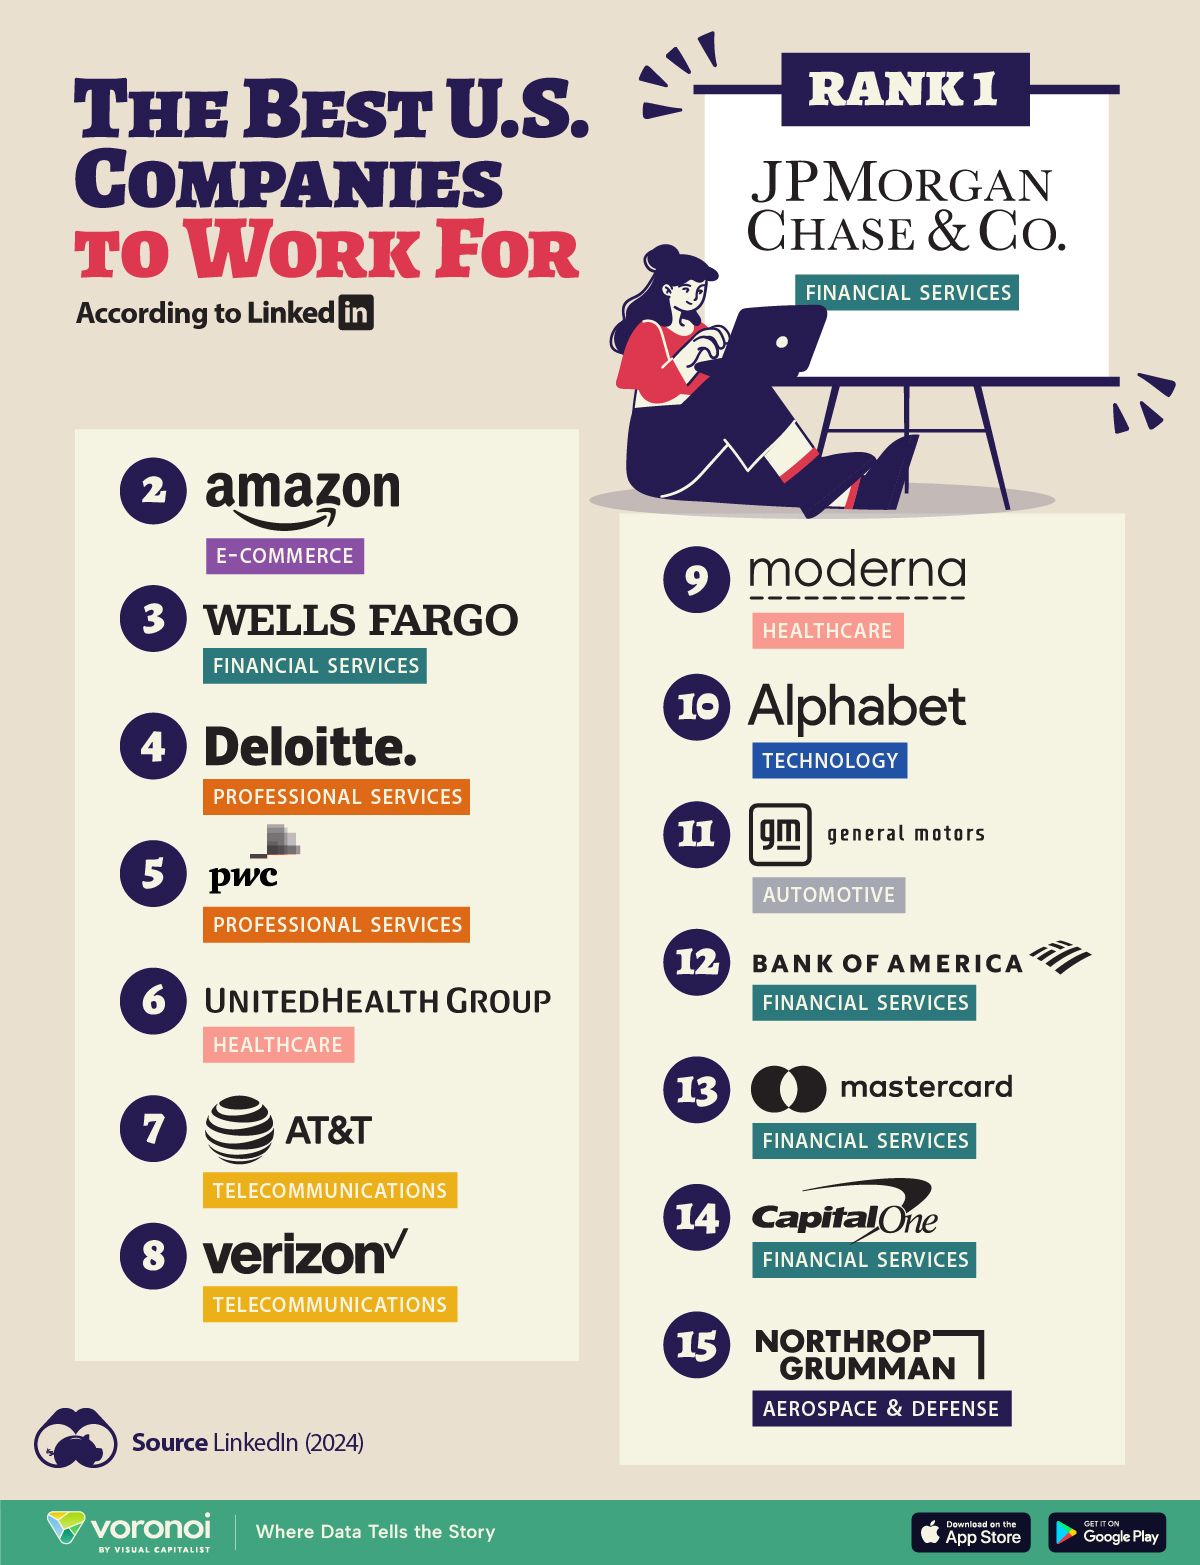
The Best U.S. Companies to Work for According to LinkedIn
We visualized the results of a LinkedIn study on the best U.S. companies to work for in 2024.
The Best U.S. Companies to Work for According to LinkedIn
This was originally posted on our Voronoi app. Download the app for free on iOS or Android and discover incredible data-driven charts from a variety of trusted sources.
In this graphic, we list the 15 best U.S. companies to work for in 2024, according to LinkedIn data.
LinkedIn ranked companies based on eight pillars: ability to advance, skills growth, company stability, external opportunity, company affinity, gender diversity, educational background, and employee presence in the country.
To be eligible, companies must have had 5,000 or more global employees, with at least 500 in the country as of December 31, 2023.
Data and Highlights
Financial institutions dominate the ranking of the best U.S. companies to work for in 2024, with JP Morgan Chase & Co. ranking first.
| Rank | Company | Industry |
|---|---|---|
| 1 | JP Morgan Chase & Co. | Financial Services |
| 2 | Amazon | E-commerce |
| 3 | Wells Fargo | Financial Services |
| 4 | Deloitte | Professional Services |
| 5 | PwC | Professional Services |
| 6 | UnitedHealth Group | Healthcare |
| 7 | AT&T | Telecommunications |
| 8 | Verizon | Telecommunications |
| 9 | Moderna | Pharmaceuticals |
| 10 | Alphabet Inc. | Technology |
| 11 | General Motors | Automotive |
| 12 | Bank of America | Financial Services |
| 13 | Mastercard | Financial Services |
| 14 | Capital One | Financial Services |
| 15 | Northrop Grumman | Aerospace & Defense |
J.P. Morgan has a program that offers opportunities for candidates without a university degree. In fact, in 2022, 75% of job descriptions at the bank for experienced hires did not require a college degree.
Meanwhile, Deloitte and Amazon offer a variety of free training courses, including in AI.
Moderna includes in its employee package benefits to help avoid employee burnout — from subsidized commuter expenses and pop-up daycare centers, to wellness coaches.
Mastercard offers flexible work availability, with 11.5% remote and 89% hybrid options.
It’s also interesting to note that only Amazon and Alphabet made the cut from the ‘Magnificent Seven’ companies (Apple, Microsoft, Google parent Alphabet, Amazon, Nvidia, Meta Platforms, and Tesla).
See more about the best companies to work for in this infographic, which covers a separate ranking from Glassdoor.

-

 Economy7 days ago
VC+: Get Our Key Takeaways From the IMF’s World Economic Outlook
-

 Maps2 weeks ago
The Largest Earthquakes in the New York Area (1970-2024)
-

 Green2 weeks ago
Ranked: The Countries With the Most Air Pollution in 2023
-

 Green2 weeks ago
Ranking the Top 15 Countries by Carbon Tax Revenue
-

 Markets2 weeks ago
U.S. Debt Interest Payments Reach $1 Trillion
-

 Mining2 weeks ago
Gold vs. S&P 500: Which Has Grown More Over Five Years?
-

 Energy2 weeks ago
The World’s Biggest Nuclear Energy Producers
-

 Misc2 weeks ago
How Hard Is It to Get Into an Ivy League School?