Markets
Visualized: Real Interest Rates by Country
![]() Subscribe to the Elements free mailing list for more like this
Subscribe to the Elements free mailing list for more like this
Visualized: Real Interest Rates of Major World Economies
This was originally posted on Elements. Sign up to the free mailing list to get beautiful visualizations on real assets and resource megatrends each week.
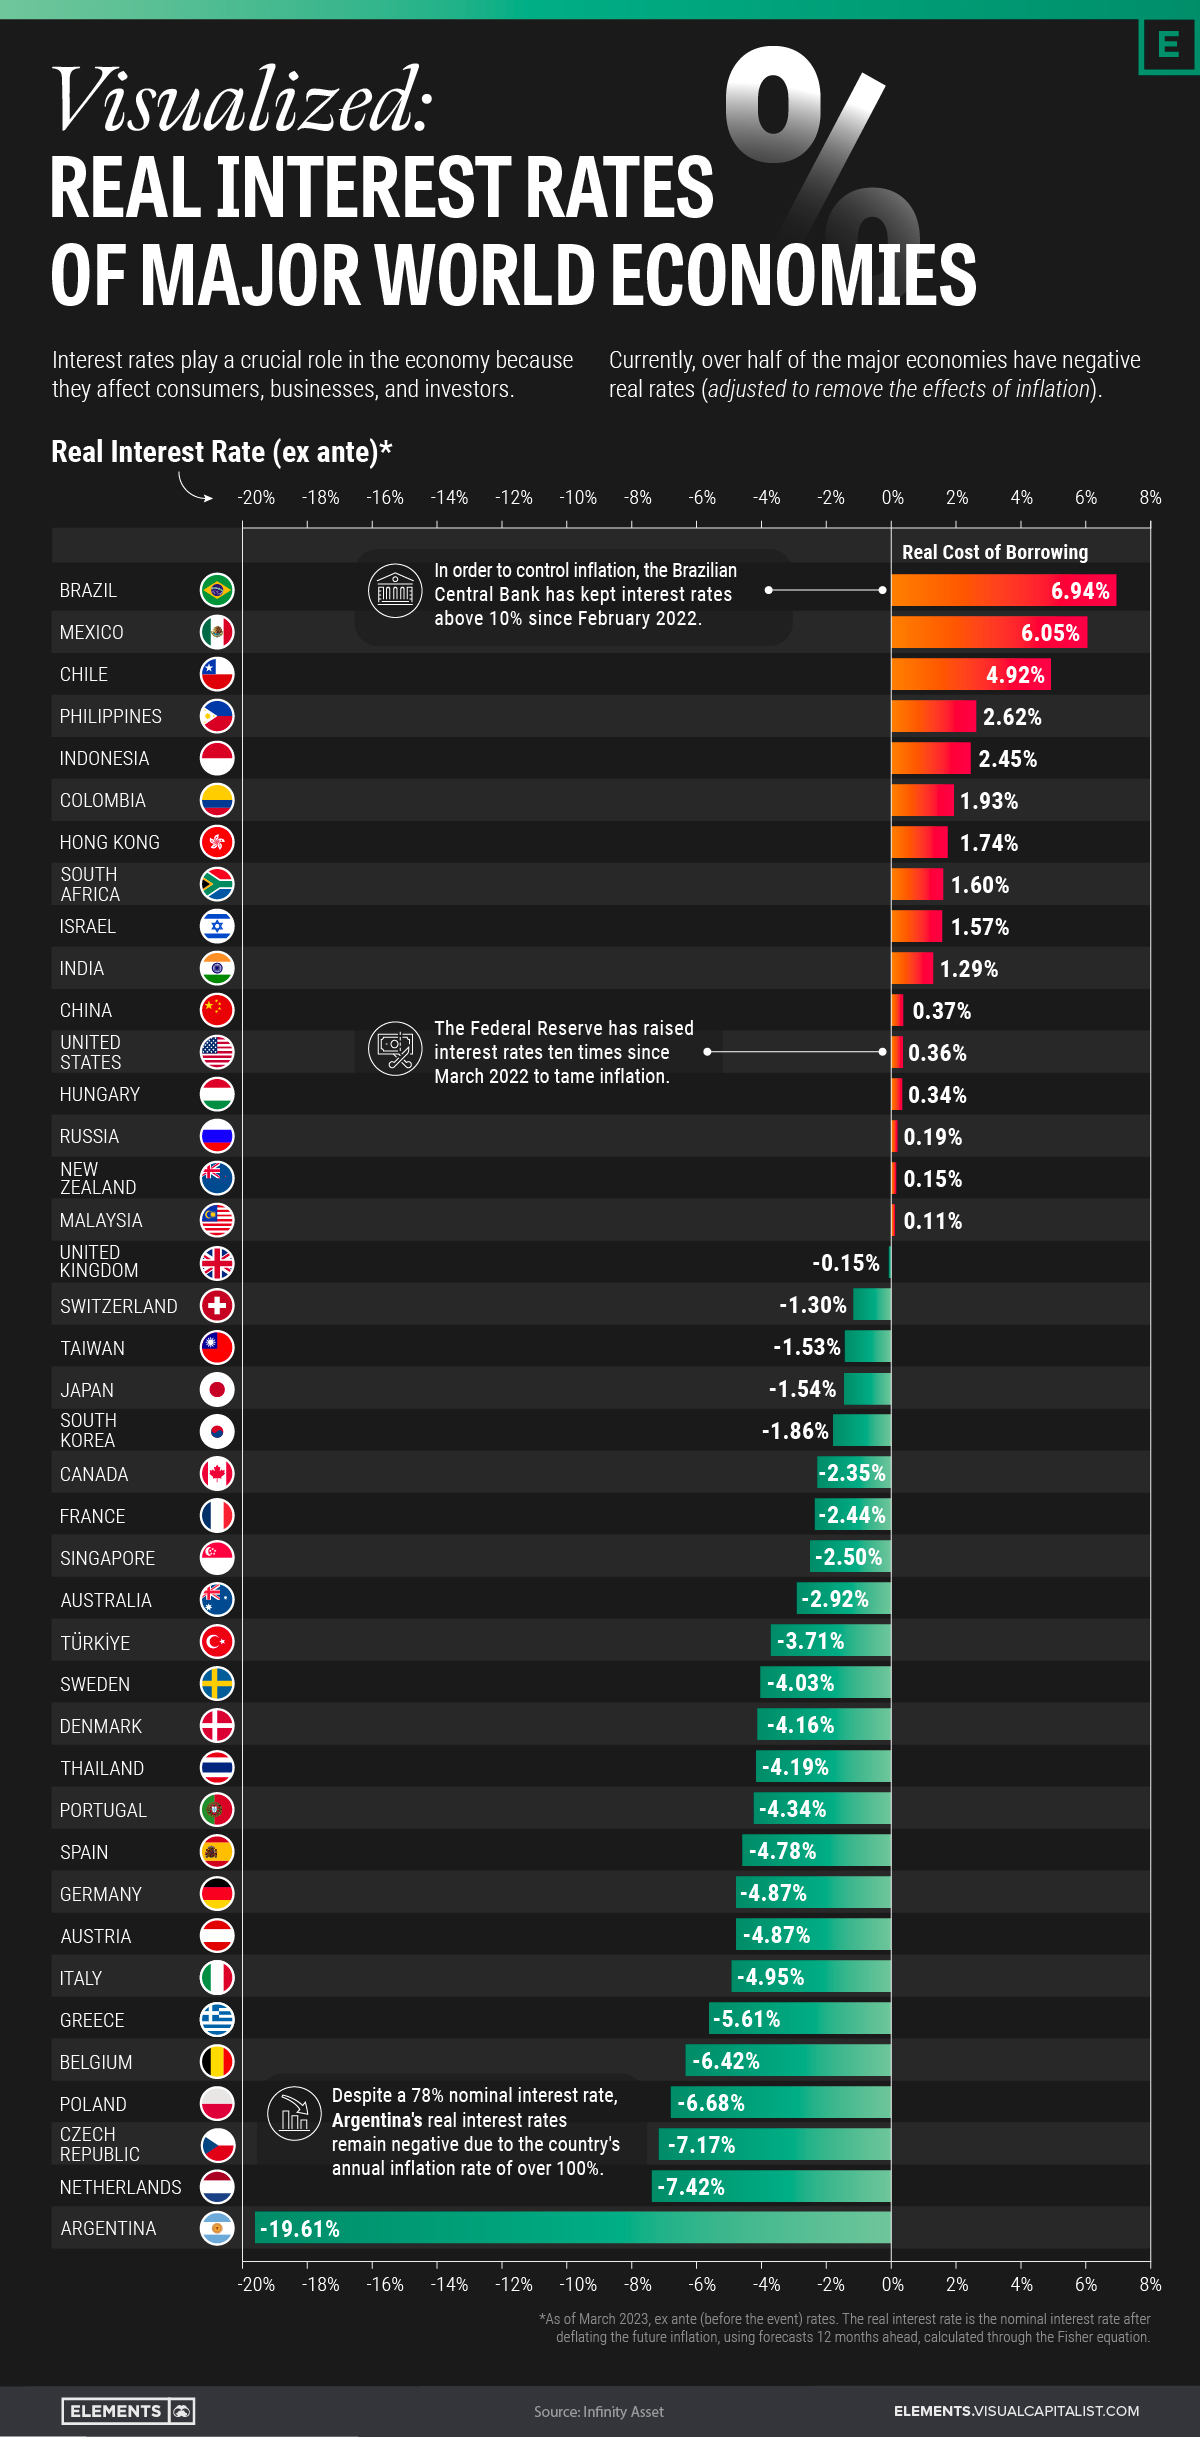
Interest rates play a crucial role in the economy because they affect consumers, businesses, and investors alike.
They can have significant implications for people’s ability to access credit, manage debts, and buy more expensive goods such as cars and houses.
This graphic uses data from Infinity Asset Management to visualize the real interest rates (ex ante) of 40 major world economies, by subtracting projected inflation over the next 12 months from current nominal rates.
Nominal Interest Rates vs. Real Interest Rates
Nominal interest rates refer to the rate at which money can be borrowed or lent at face value, without considering any other factors like inflation.
Meanwhile, the real interest rate is the nominal interest rate after taking into account inflation, reflecting the true cost of borrowing or lending. Real interest rates can fluctuate over time and are influenced by various factors such as inflation, central bank policies, and economic growth. They can also influence economic growth by affecting investment and consumption decisions.
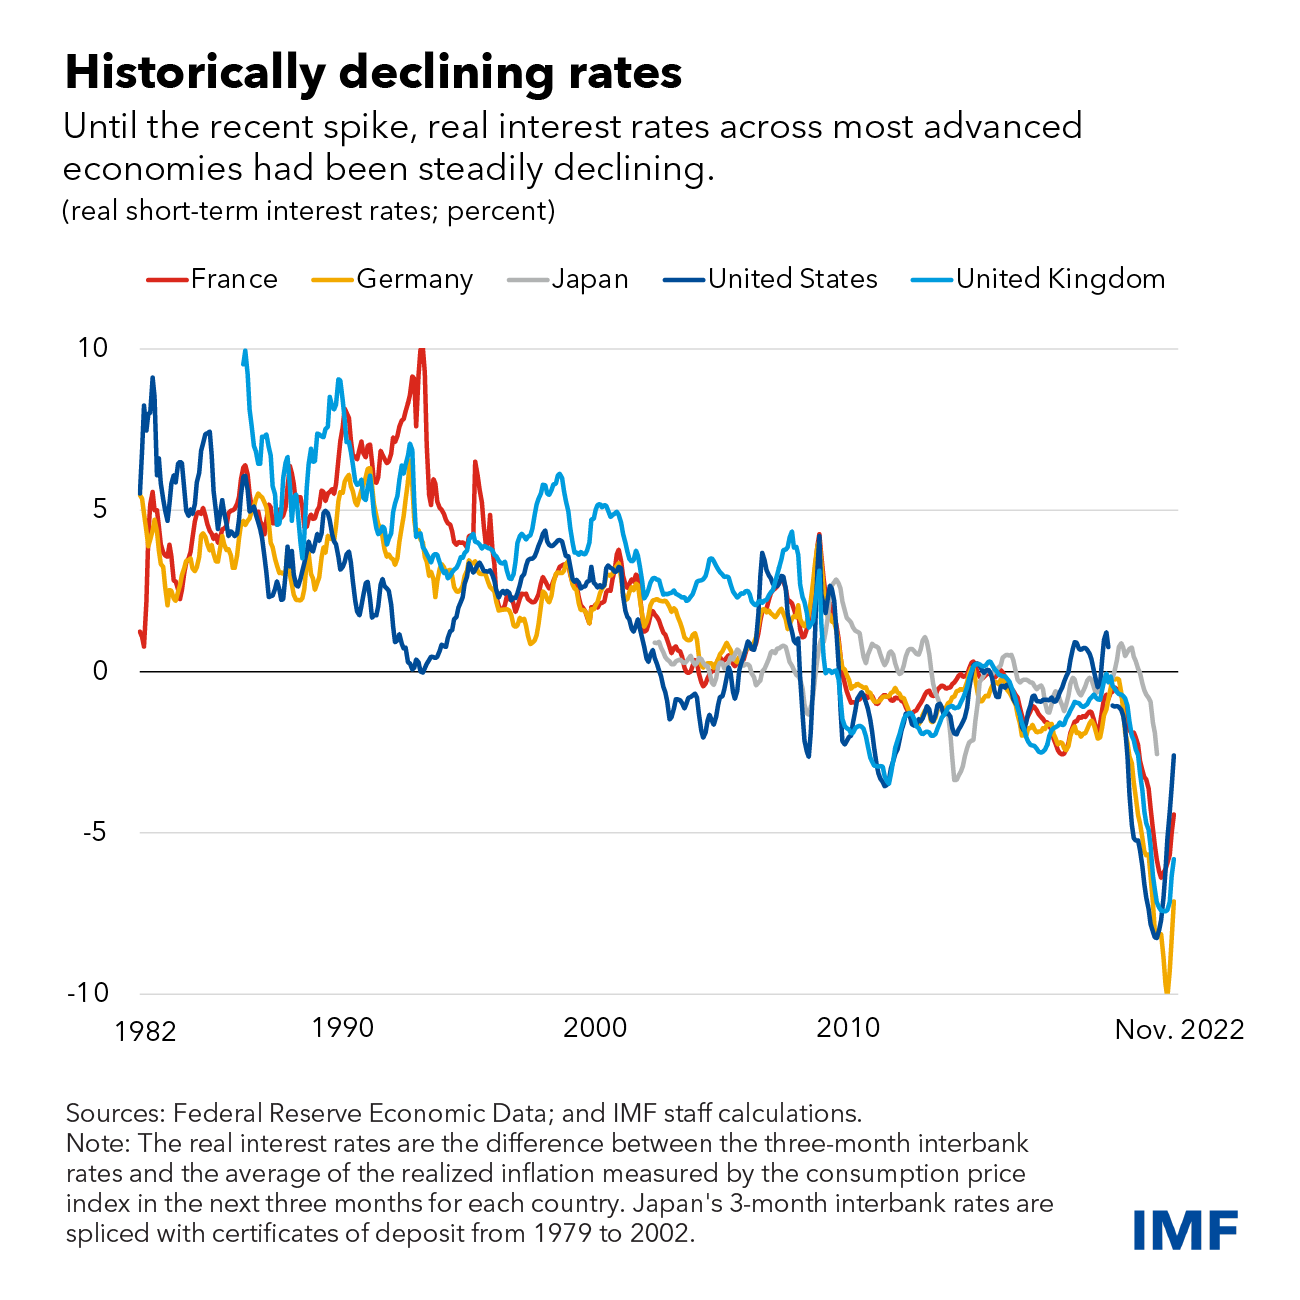
According to the International Monetary Fund (IMF), since the mid-1980s, real interest rates across several advanced economies have declined steadily.
As of March 2023, Brazil has the highest real interest rate among the 40 major economies shown in this dataset.
Below we look at Brazil’s situation, along with the data of the four other major economies with the highest real rates in the dataset:
| Nominal Interest Rate | Real Interest Rate | |
|---|---|---|
| 🇧🇷 Brazil | 13.75% | 6.94% |
| 🇲🇽 Mexico | 11.00% | 6.05% |
| 🇨🇱 Chile | 11.25% | 4.92% |
| 🇵🇭 Philippines | 6.00% | 2.62% |
| 🇮🇩 Indonesia | 5.75% | 2.45% |
In general, countries with high interest rates offer investors higher yields on their investments but also come with higher risks due to volatile economies and political instability.
Below are the five countries in the dataset with the lowest real rates:
| Nominal Interest Rate | Real Interest Rate | |
|---|---|---|
| 🇦🇷 Argentina | 78.00% | -19.61% |
| 🇳🇱 Netherlands | 3.50% | -7.42% |
| 🇨🇿 Czech Republic | 7.00% | -7.17% |
| 🇵🇱 Poland | 6.75% | -6.68% |
| 🇧🇪 Belgium | 3.50% | -6.42% |
Hyperinflation, as seen in Argentina, can lead to anomalies in both real and nominal rates, causing problems for the country’s broader economy and financial system.
As you can see above, with a 78% nominal interest rate, Argentina’s real interest rates remain the lowest on the planet due to a staggering annual inflation rate of over 100%.
Interest Rate Outlook
Increasing inflation and tighter monetary policy have resulted in rapid increases in nominal interest rates recently in many countries.
However, IMF analysis suggests that recent increases could be temporary.
Central banks in advanced economies are likely to ease monetary policy and bring interest rates back to pre-pandemic levels when inflation is brought under control, according to the fund.


Markets
The European Stock Market: Attractive Valuations Offer Opportunities
On average, the European stock market has valuations that are nearly 50% lower than U.S. valuations. But how can you access the market?


European Stock Market: Attractive Valuations Offer Opportunities
Europe is known for some established brands, from L’Oréal to Louis Vuitton. However, the European stock market offers additional opportunities that may be lesser known.
The above infographic, sponsored by STOXX, outlines why investors may want to consider European stocks.
Attractive Valuations
Compared to most North American and Asian markets, European stocks offer lower or comparable valuations.
| Index | Price-to-Earnings Ratio | Price-to-Book Ratio |
|---|---|---|
| EURO STOXX 50 | 14.9 | 2.2 |
| STOXX Europe 600 | 14.4 | 2 |
| U.S. | 25.9 | 4.7 |
| Canada | 16.1 | 1.8 |
| Japan | 15.4 | 1.6 |
| Asia Pacific ex. China | 17.1 | 1.8 |
Data as of February 29, 2024. See graphic for full index names. Ratios based on trailing 12 month financials. The price to earnings ratio excludes companies with negative earnings.
On average, European valuations are nearly 50% lower than U.S. valuations, potentially offering an affordable entry point for investors.
Research also shows that lower price ratios have historically led to higher long-term returns.
Market Movements Not Closely Connected
Over the last decade, the European stock market had low-to-moderate correlation with North American and Asian equities.
The below chart shows correlations from February 2014 to February 2024. A value closer to zero indicates low correlation, while a value of one would indicate that two regions are moving in perfect unison.
| EURO STOXX 50 | STOXX EUROPE 600 | U.S. | Canada | Japan | Asia Pacific ex. China |
|
|---|---|---|---|---|---|---|
| EURO STOXX 50 | 1.00 | 0.97 | 0.55 | 0.67 | 0.24 | 0.43 |
| STOXX EUROPE 600 | 1.00 | 0.56 | 0.71 | 0.28 | 0.48 | |
| U.S. | 1.00 | 0.73 | 0.12 | 0.25 | ||
| Canada | 1.00 | 0.22 | 0.40 | |||
| Japan | 1.00 | 0.88 | ||||
| Asia Pacific ex. China | 1.00 |
Data is based on daily USD returns.
European equities had relatively independent market movements from North American and Asian markets. One contributing factor could be the differing sector weights in each market. For instance, technology makes up a quarter of the U.S. market, but health care and industrials dominate the broader European market.
Ultimately, European equities can enhance portfolio diversification and have the potential to mitigate risk for investors.
Tracking the Market
For investors interested in European equities, STOXX offers a variety of flagship indices:
| Index | Description | Market Cap |
|---|---|---|
| STOXX Europe 600 | Pan-regional, broad market | €10.5T |
| STOXX Developed Europe | Pan-regional, broad-market | €9.9T |
| STOXX Europe 600 ESG-X | Pan-regional, broad market, sustainability focus | €9.7T |
| STOXX Europe 50 | Pan-regional, blue-chip | €5.1T |
| EURO STOXX 50 | Eurozone, blue-chip | €3.5T |
Data is as of February 29, 2024. Market cap is free float, which represents the shares that are readily available for public trading on stock exchanges.
The EURO STOXX 50 tracks the Eurozone’s biggest and most traded companies. It also underlies one of the world’s largest ranges of ETFs and mutual funds. As of November 2023, there were €27.3 billion in ETFs and €23.5B in mutual fund assets under management tracking the index.
“For the past 25 years, the EURO STOXX 50 has served as an accurate, reliable and tradable representation of the Eurozone equity market.”
— Axel Lomholt, General Manager at STOXX
Partnering with STOXX to Track the European Stock Market
Are you interested in European equities? STOXX can be a valuable partner:
- Comprehensive, liquid and investable ecosystem
- European heritage, global reach
- Highly sophisticated customization capabilities
- Open architecture approach to using data
- Close partnerships with clients
- Part of ISS STOXX and Deutsche Börse Group
With a full suite of indices, STOXX can help you benchmark against the European stock market.
Learn how STOXX’s European indices offer liquid and effective market access.

-

 Economy3 days ago
Economic Growth Forecasts for G7 and BRICS Countries in 2024
The IMF has released its economic growth forecasts for 2024. How do the G7 and BRICS countries compare?
-

 Markets2 weeks ago
U.S. Debt Interest Payments Reach $1 Trillion
U.S. debt interest payments have surged past the $1 trillion dollar mark, amid high interest rates and an ever-expanding debt burden.
-

 United States2 weeks ago
Ranked: The Largest U.S. Corporations by Number of Employees
We visualized the top U.S. companies by employees, revealing the massive scale of retailers like Walmart, Target, and Home Depot.
-

 Markets2 weeks ago
The Top 10 States by Real GDP Growth in 2023
This graphic shows the states with the highest real GDP growth rate in 2023, largely propelled by the oil and gas boom.
-

 Markets3 weeks ago
Ranked: The World’s Top Flight Routes, by Revenue
In this graphic, we show the highest earning flight routes globally as air travel continued to rebound in 2023.
-

 Markets3 weeks ago
Ranked: The Most Valuable Housing Markets in America
The U.S. residential real estate market is worth a staggering $47.5 trillion. Here are the most valuable housing markets in the country.


-

 Science1 week ago
Visualizing the Average Lifespans of Mammals
-

 Demographics2 weeks ago
The Smallest Gender Wage Gaps in OECD Countries
-

 United States2 weeks ago
Where U.S. Inflation Hit the Hardest in March 2024
-

 Green2 weeks ago
Top Countries By Forest Growth Since 2001
-
United States2 weeks ago
Ranked: The Largest U.S. Corporations by Number of Employees
-

 Maps2 weeks ago
The Largest Earthquakes in the New York Area (1970-2024)
-

 Green2 weeks ago
Ranked: The Countries With the Most Air Pollution in 2023
-

 Green2 weeks ago
Ranking the Top 15 Countries by Carbon Tax Revenue