Datastream
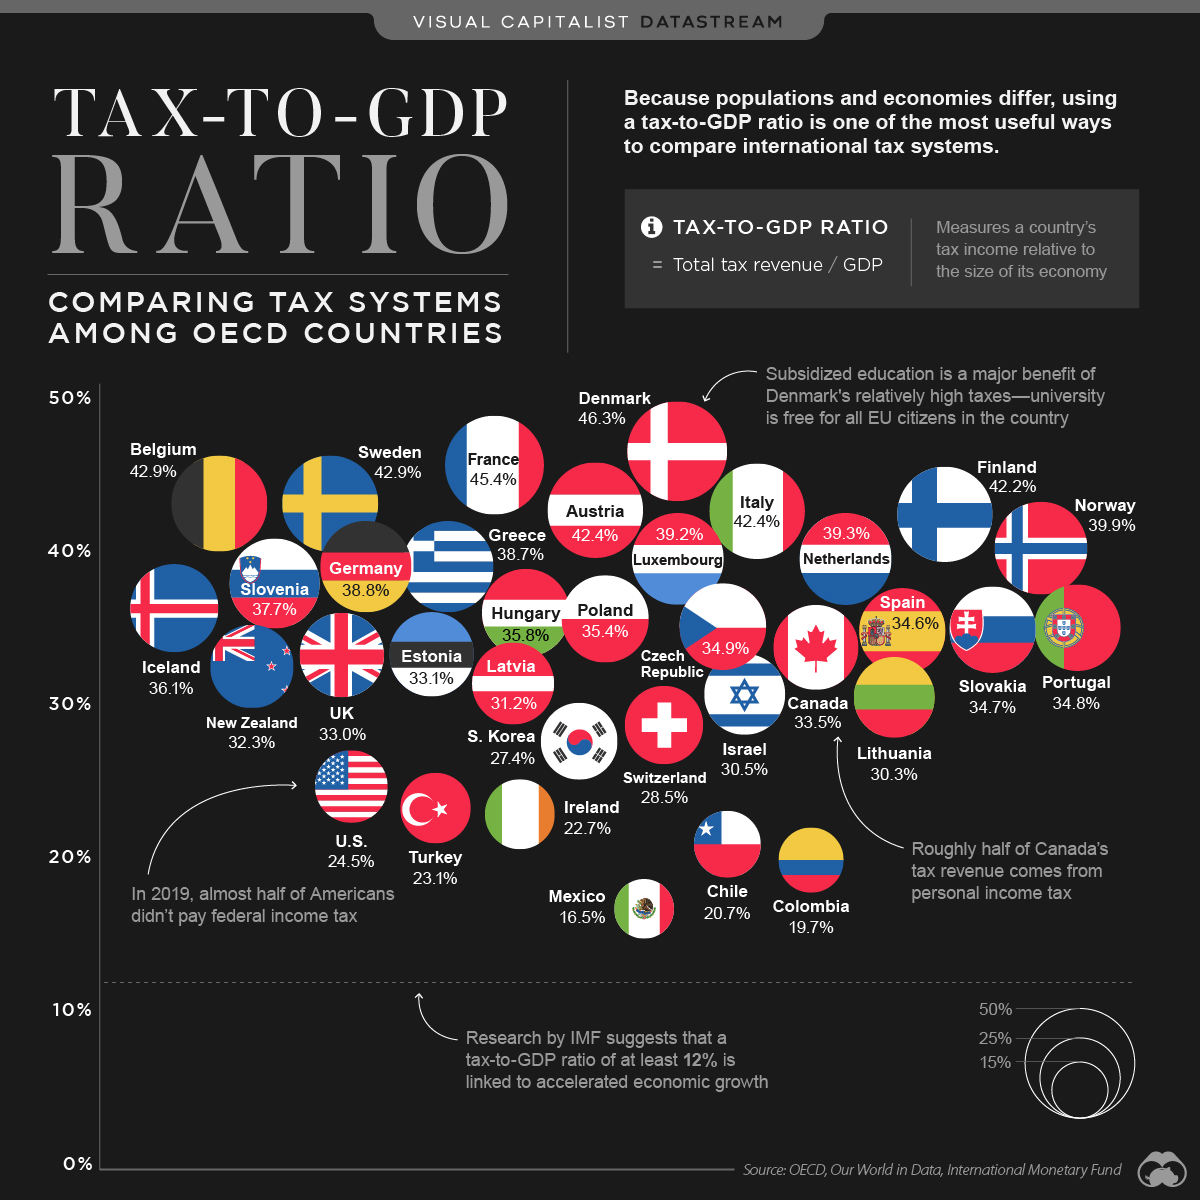
Tax-to-GDP Ratio: Comparing Tax Systems Around the World


The Briefing
- The tax-to-GDP ratio measures a country’s tax revenue, relative to the size of its economy (measured by its Gross Domestic Product, or GDP)
- A higher tax-to-GDP ratio means more money is going to government coffers, and in theory, public services like education and infrastructure
- Out of 35 OECD countries, Denmark has the highest tax-to-GDP ratio at 46.3%, while Mexico ranks last at 16.5%
Tax-to-GDP Ratio: Comparing Tax Systems Around the World
Taxes are an important source of revenue for most countries. In fact, taxes provide around 50% or more of government funds in almost every country in the world.
How does each country’s tax system compare to one another? This question is tricky to answer. Since countries’ populations and economies differ greatly, measuring total tax revenue is not the best way to compare international tax systems.
Instead, using a tax-to-GDP ratio is one of the more useful ways to compare tax systems around the world.
What is the Tax-to-GDP Ratio?
The tax-to-GDP ratio compares a country’s tax revenue to the size of its economy, which in this case is measured by its GDP.
The higher the ratio, the higher the proportion of money that goes to government coffers. If managed effectively, this can support the long-term health and prosperity of an economy. According to research conducted by the International Monetary Fund, countries should have a tax-to-GDP ratio of at least 12% in order to experience accelerated economic growth.
The countries that are part of the Organisation for Economic Co-operation and Development (OECD) all meet that threshold, with an average tax-to-GDP ratio of 33.8%.
Ranked: The Tax-to-GDP Ratios of OECD countries
The dataset used for this graphic looks at 35 of the 37 OECD countries, since recent data for Australia and Japan was not available.
| Rank | Country | Tax Revenue as % of GDP |
|---|---|---|
| 1 | 🇩🇰 Denmark | 46.3% |
| 2 | 🇫🇷 France | 45.4% |
| 3 | 🇧🇪 Belgium | 42.9% |
| 4 | 🇸🇪 Sweden | 42.9% |
| 5 | 🇦🇹 Austria | 42.4% |
| 6 | 🇮🇹 Italy | 42.4% |
| 7 | 🇫🇮 Finland | 42.2% |
| 8 | 🇳🇴 Norway | 39.9% |
| 9 | 🇳🇱 Netherlands | 39.3% |
| 10 | 🇱🇺 Luxembourg | 39.2% |
| 11 | 🇩🇪 Germany | 38.8% |
| 12 | 🇬🇷 Greece | 38.7% |
| 13 | 🇸🇮 Slovenia | 37.7% |
| 14 | 🇮🇸 Iceland | 36.1% |
| 15 | 🇭🇺 Hungary | 35.8% |
| 16 | 🇵🇱 Poland | 35.4% |
| 17 | 🇨🇿 Czech Republic | 34.9% |
| 18 | 🇵🇹 Portugal | 34.8% |
| 19 | 🇸🇰 Slovak Republic | 34.7% |
| 20 | 🇪🇸 Spain | 34.6% |
| 21 | 🇨🇦 Canada | 33.5% |
| 22 | 🇪🇪 Estonia | 33.1% |
| 23 | 🇬🇧 United Kingdom | 33.0% |
| 24 | 🇳🇿 New Zealand | 32.3% |
| 25 | 🇱🇻 Latvia | 31.2% |
| 26 | 🇮🇱 Israel | 30.5% |
| 27 | 🇱🇹 Lithuania | 30.3% |
| 28 | 🇨🇭 Switzerland | 28.5% |
| 29 | 🇰🇷 South Korea | 27.4% |
| 30 | 🇺🇸 United States | 24.5% |
| 31 | 🇹🇷 Turkey | 23.1% |
| 32 | 🇮🇪 Ireland | 22.7% |
| 33 | 🇨🇱 Chile | 20.7% |
| 34 | 🇨🇴 Colombia | 19.7% |
| 35 | 🇲🇽 Mexico | 16.5% |
| OECD Average | 33.8% |
At 46.3%, Denmark has the highest ratio on the list. The country puts its relatively high tax revenue to use, particularly when it comes to subsidizing post-secondary education—in Denmark, university is free for all EU citizens.
On the less-taxed end of the spectrum, the U.S. ranks 30 out of 35, with a ratio of 24.5%—that’s notably lower than the OECD average of 33.8%. It’s also worth mentioning that the U.S. has one of the highest GDP per capita measures out of all OECD countries.
Where does America’s tax revenue come from? It gains most of its revenue from the personal income tax. In fact, 41% of the country’s total tax revenue comes from taxes on personal income, as well as individual profits and gains—for context, the OECD average is 24%.
With President Biden’s recent announcement to increase corporate taxes and personal investment gains, America’s ratio could look a lot different in the near future.
>>Like this? You might find this article interesting, Unequal State Tax Burdens Across America
Where does this data come from?
Source: OECD
Details: This source uses 2019 provisional data to calculate each country’s tax-to-GDP ratio. For more information on methodology, read the full report by clicking here.


Datastream
Can You Calculate Your Daily Carbon Footprint?
Discover how the average person’s carbon footprint impacts the environment and learn how carbon credits can offset your carbon footprint.


The Briefing
- A person’s carbon footprint is substantial, with activities such as food consumption creating as much as 4,500 g of CO₂ emissions daily.
- By purchasing carbon credits from Carbon Streaming Corporation, you can offset your own emissions and fund positive climate action.
Your Everyday Carbon Footprint
While many large businesses and countries have committed to net-zero goals, it is essential to acknowledge that your everyday activities also contribute to global emissions.
In this graphic, sponsored by Carbon Streaming Corporation, we will explore how the choices we make and the products we use have a profound impact on our carbon footprint.
Carbon Emissions by Activity
Here are some of the daily activities and products of the average person and their carbon footprint, according to Clever Carbon.
| Household Activities & Products | CO2 Emissions (g) |
|---|---|
| 💡 Standard Light Bulb (100 watts, four hours) | 172 g |
| 📱 Mobile Phone Use (195 minutes per day)* | 189 g |
| 👕 Washing Machine (0.63 kWh) | 275 g |
| 🔥 Electric Oven (1.56 kWh) | 675 g |
| ♨️ Tumble Dryer (2.5 kWh) | 1,000 g |
| 🧻 Toilet Roll (2 ply) | 1,300 g |
| 🚿 Hot Shower (10 mins) | 2,000 g |
| 🚙 Daily Commute (one hour, by car) | 3,360 g |
| 🍽️ Average Daily Food Consumption (three meals of 600 calories) | 4,500 g |
| *Phone use based on yearly use of 69kg per the source, Reboxed | |
Your choice of transportation plays a crucial role in determining your carbon footprint. For instance, a 15 km daily commute to work on public transport generates an average of 1,464 g of CO₂ emissions. Compared to 3,360 g—twice the volume for a journey the same length by car.
By opting for more sustainable modes of transport, such as cycling, walking, or public transportation, you can significantly reduce your carbon footprint.
Addressing Your Carbon Footprint
One way to compensate for your emissions is by purchasing high-quality carbon credits.
Carbon credits are used to help fund projects that avoid, reduce or remove CO₂ emissions. This includes nature-based solutions such as reforestation and improved forest management, or technology-based solutions such as the production of biochar and carbon capture and storage (CCS).
While carbon credits offer a potential solution for individuals to help reduce global emissions, public awareness remains a significant challenge. A BCG-Patch survey revealed that only 34% of U.S. consumers are familiar with carbon credits, and only 3% have purchased them in the past.
About Carbon Streaming
By financing the creation or expansion of carbon projects, Carbon Streaming Corporation secures the rights to future carbon credits generated by these sustainable projects. You can then purchase these carbon credits to help fund climate solutions around the world and compensate for your own emissions.
Ready to get involved?
>> Learn more about purchasing carbon credits at Carbon Streaming

-

 Markets1 week ago
U.S. Debt Interest Payments Reach $1 Trillion
-

 Markets2 weeks ago
Ranked: The Most Valuable Housing Markets in America
-

 Money2 weeks ago
Which States Have the Highest Minimum Wage in America?
-

 AI2 weeks ago
Ranked: Semiconductor Companies by Industry Revenue Share
-

 Markets2 weeks ago
Ranked: The World’s Top Flight Routes, by Revenue
-

 Countries2 weeks ago
Population Projections: The World’s 6 Largest Countries in 2075
-

 Markets2 weeks ago
The Top 10 States by Real GDP Growth in 2023
-

 Money2 weeks ago
The Smallest Gender Wage Gaps in OECD Countries