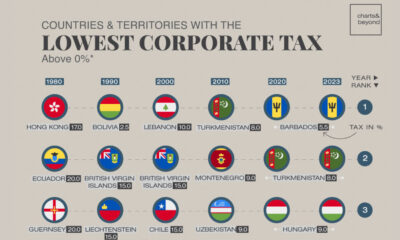
Many countries with the lowest corporate tax rates are clustered in Europe and Asia, with tax rates far below the...


click for more →


Scan with your phone's camera or QR code app to view
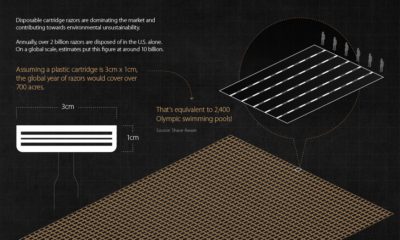

The mainstream shaving industry no longer fits the needs of modern society. This graphic shows why it's time to rethink shaving
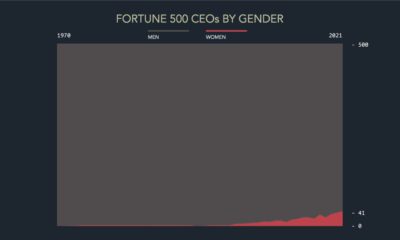

The gender gap in corporate America is still prevalent, especially in leadership roles. In 2021, only 8.2% of Fortune 500 CEOs were female.
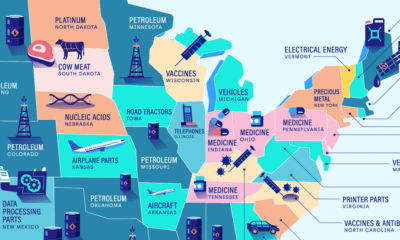

Petroleum is the top import in twelve states, making it the most commonly imported commodity across America. Here are America’s top imports.
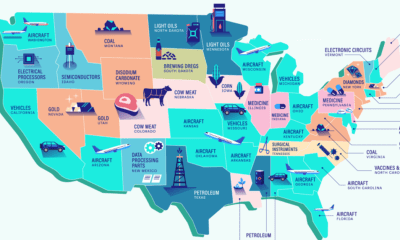

From Nevada gold to Maine’s top-tier lobsters, here are America’s top exports by state.
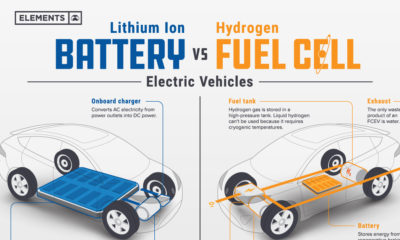

Understand the science behind hydrogen fuel cell vehicles, and how they differ from traditional EVs.
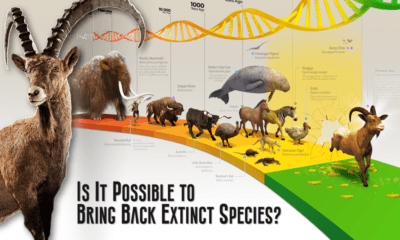

This graphic provides an introduction to de-extinction, a field of biology focused on reviving extinct animal species.
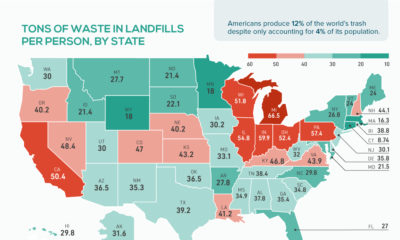

The U.S. is the world’s most wasteful country. In this graphic by Northstar Clean Technologies, we map tons of waste in landfills per person, by state.


In this infographic, we examine new data that ranks the top 25 countries by their default risk.
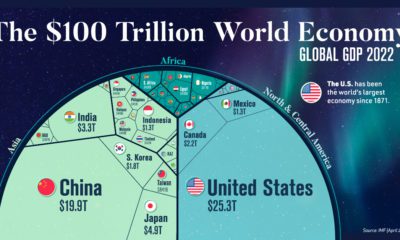

Despite ripple effects from conflict and inflation, global growth continues. According to the IMF, the global GDP will hit $104 trillion by end of year.
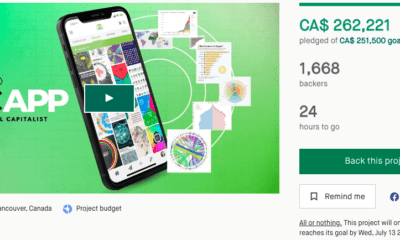

Thanks to the incredible Visual Capitalist community, the VC App has hit its funding target and will now be built. Thank you! There are just a...


We're closing in on reaching our funding goal for the VC App, but still need your help. Just 2 days are left to hit the goal.
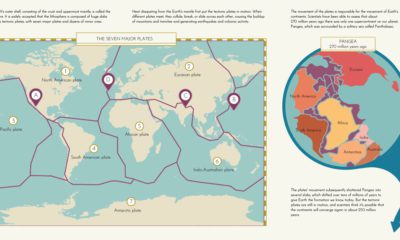

This graphic provides an explanation of plate tectonics and highlights the seven major tectonic plates that make up Earth’s outer crust.
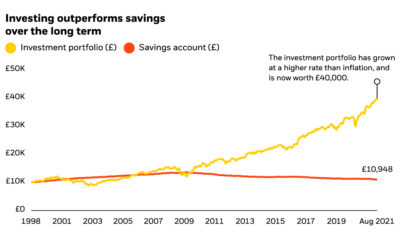

First-time investors are faced with an overwhelming amount of information and choices. See how BlackRock is simplifying the process.
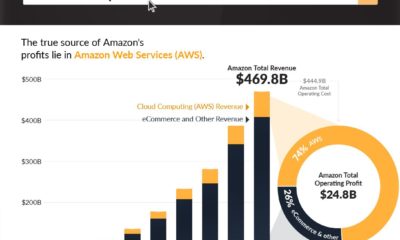

Amazon is best known for its sprawling ecommerce empire, but three-quarters of the company's profits actually come from cloud computing.
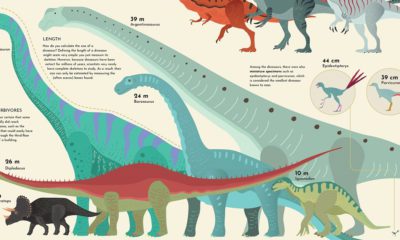

The largest dinosaur that ever lived was as long as a 13-story building. We show how the sizes of dinosaurs measured up.


This graphic compares the cost of living and purchasing power of 578 cities worldwide, using New York City as a benchmark for comparison.
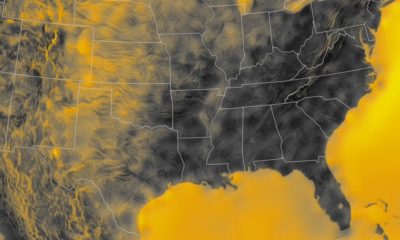

Wind is a great renewable energy source, but the spread of potential power is uneven. This graphic maps the average wind speed of the continental U.S.


 Creator Program
