
We compare America's top 10 companies by revenue in 1994 and 2023 to see how the business landscape has changed.


click for more →


Scan with your phone's camera or QR code app to view


Recent floods in Pakistan have affected more than 33 million people. Where is the risk of flooding highest around the world?
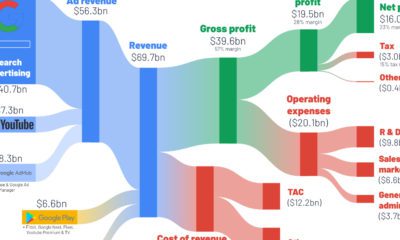

How do the big tech giants make their money? This series of graphics shows a breakdown of big tech revenue, using Q2 2022 income statements.
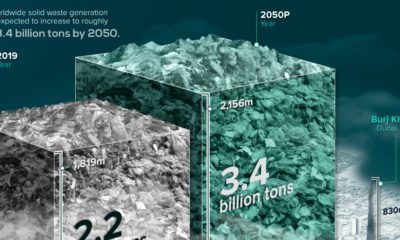

Waste generation is expected to jump over the next 30 years. See global waste visualized over this time period, along with waste per person.
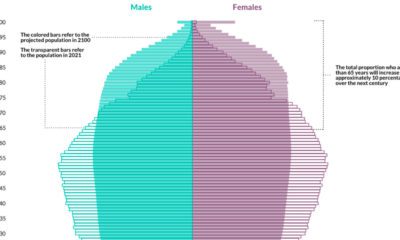

The EU's population is aging rapidly. By 2100, more than 30% of the region’s population is expected to be 65 or older.
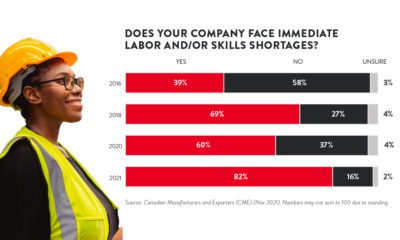

More than four in five manufacturers say they face an immediate skills or labor shortage. What steps can be taken to address the shortages?
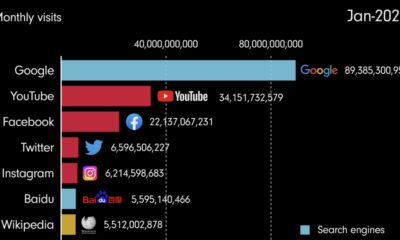

This video shows the evolution of the internet, highlighting the most popular websites from 1993 until 2022.
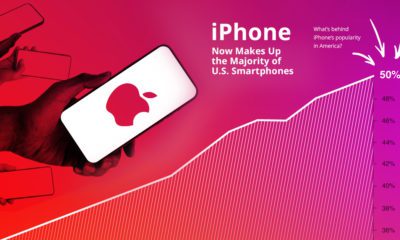

Apple's flagship device has captured a modest 16% of the global market, and Android dominates globally. Why do so many Americans keep buying iPhones?
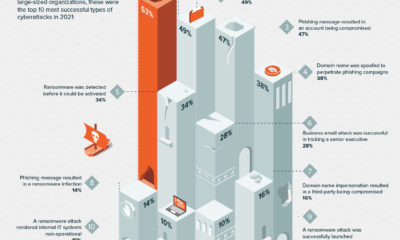

Recent research provides insight into the top cyberattacks that businesses faced in 2021. See the results in this infographic.


Can money really buy happiness? In this chart, we compare most of the world's countries to examine the relationship between wealth and happiness.
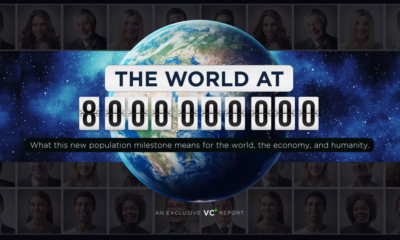

Dive into how the world’s growing population will shape the future. Join VC+ to gain exclusive access to The World at 8 Billion series.
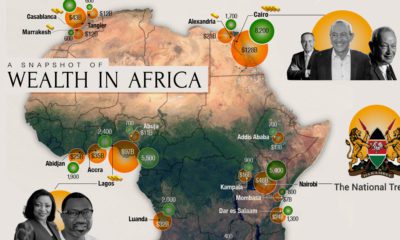

Total private wealth in Africa is now estimated to be US$2.1 trillion. This map looks at where all that wealth is concentrated around the continent.
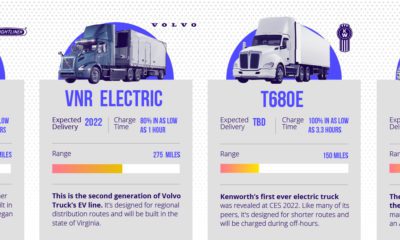

A wave of electric semi trucks is expected to arrive over the next few years. View this infographic to learn more.
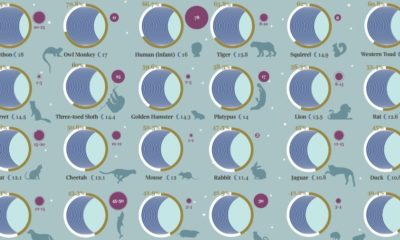

How much does a Koala sleep on average? What about an Elephant? This graphic compares the sleep patterns of 40 different animals.
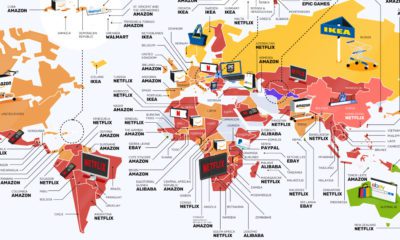

From Netflix to IKEA, this map of the world highlights the most searched for consumer brands around the world.
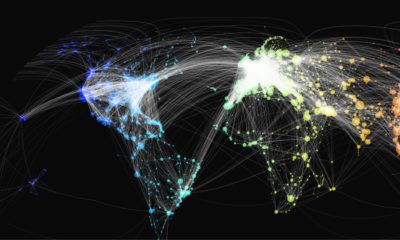

This map shows over 65,000 of the world’s flight paths and the various airports that each route connects, using data from Open Flights.
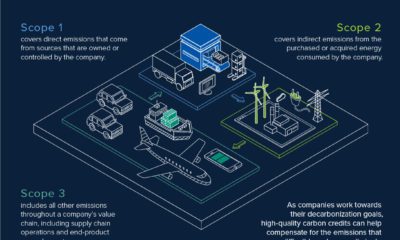

Here's a look at the 3 scopes of emissions that comprise a company's carbon footprint, according to the Greenhouse Gas Protocol. (Sponsored Content)
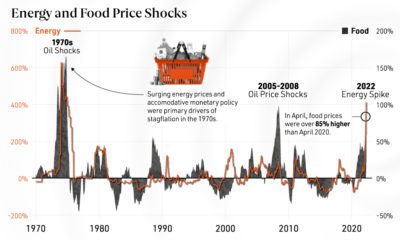

From rising inflation to food insecurity, we show why energy price shocks have far-reaching effects on the global economy.


 Creator Program