Politics
Mapped: The State of Global Democracy in 2022
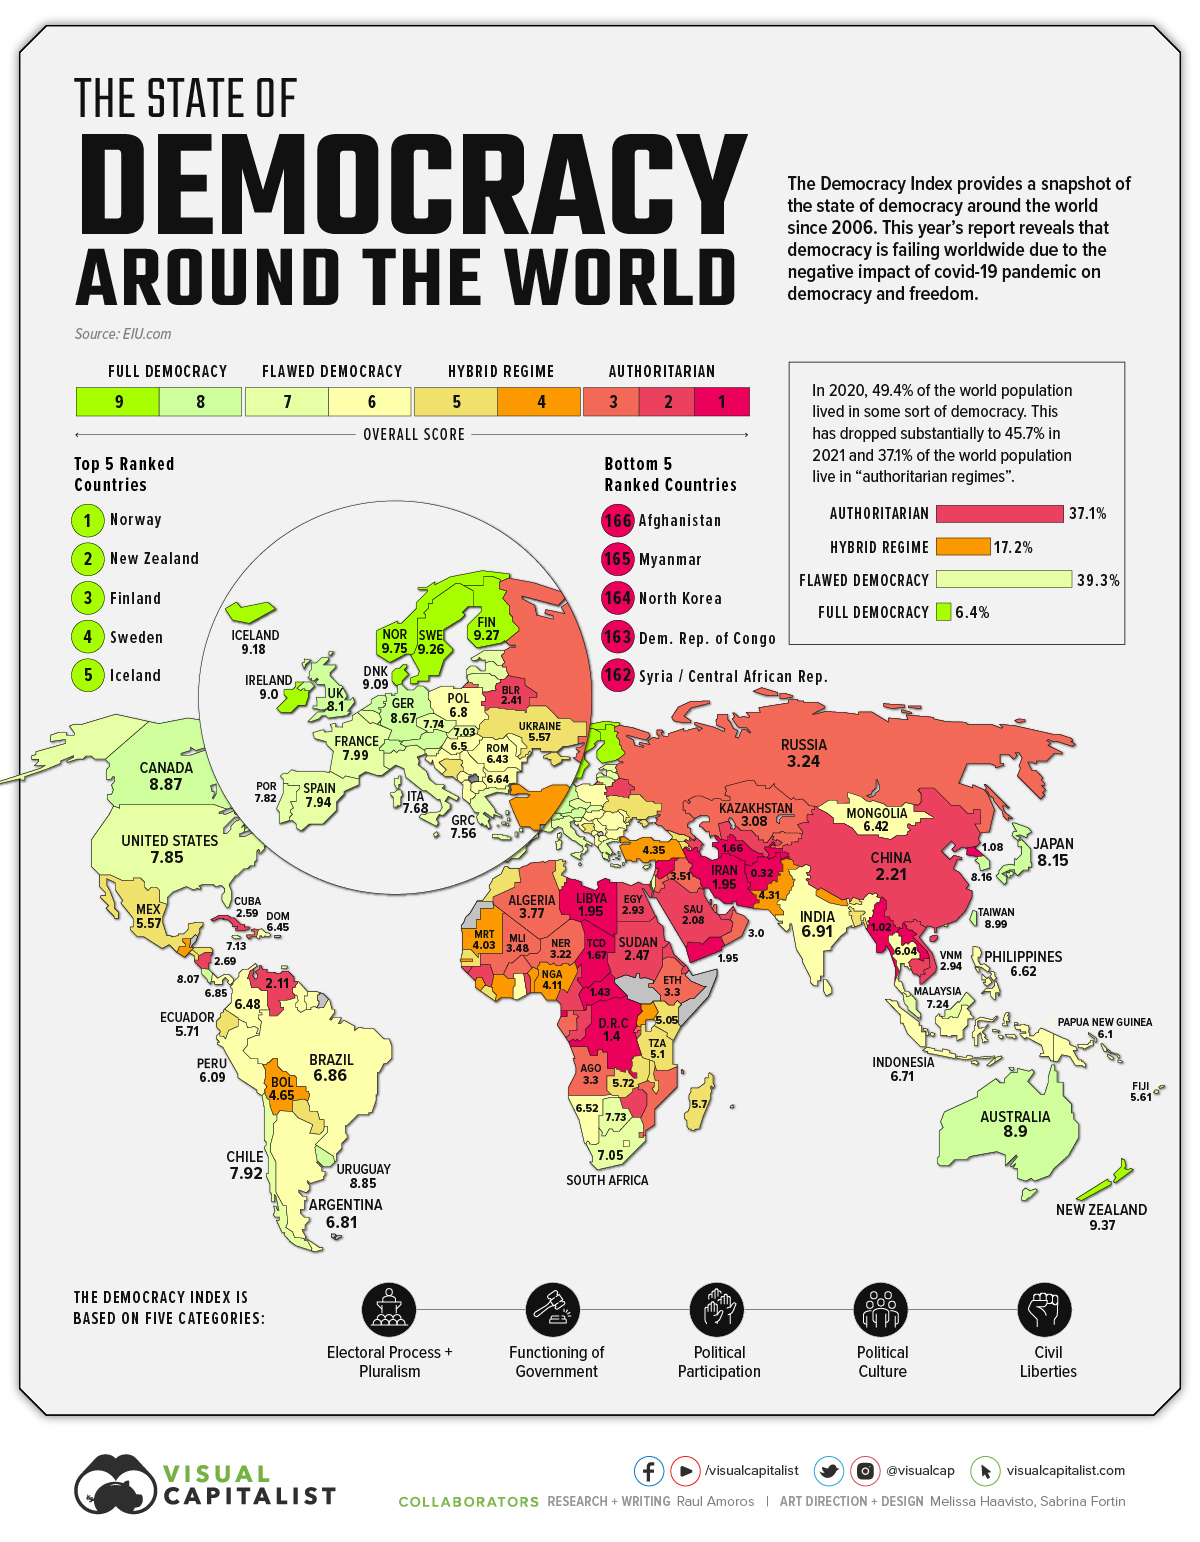


Mapped: The State of Democracy Around the World
The world’s (almost) eight billion people live under a wide variety of political and cultural circumstances. In broad terms, those circumstances can be measured and presented on a sliding scale between “free” and “not free”—the subtext being that democracy lies on one end, and authoritarianism on the other.
This year’s Democracy Index report by the Economist Intelligence Unit (EIU), is one such attempt to apply a score to countries based on how closely they measure up to democratic ideals.
According to EIU, the state of democracy is at its lowest point since the index began in 2006, blamed in part on the pandemic restrictions that saw many countries struggling to balance public health with personal freedom.
In this year’s report, the EIU reported a drop of the average global score from 5.37 to 5.28, the biggest drop since 2010 after the global financial crisis. This translates into a sobering fact: only 46% of the population is living in a democracy “of some sort.”
Let’s dive a bit deeper into what this means.
Percentage of Population by Regime Type
In 2021, 37% of the world’s population still lived under an authoritarian regime. Afghanistan tops this list, followed by Myanmar, North Korea, Democratic Republic of the Congo, and Syria. Of course, China has a big share of the population living under this style of regime.
On the other side of the spectrum we have full democracies, which only account for 6.4% of the population. Norway tops this list, followed by New Zealand, Finland, Sweden, and Iceland.
| Regime Type | No. of Countries | Share of countries | Share of World Population |
|---|---|---|---|
| Full democracies | 21 | 12.6% | 6.4% |
| Flawed democracies | 53 | 31.7% | 39.3% |
| Hybrid Regimes | 34 | 20.4% | 17.2% |
| Authoritarian regimes | 59 | 35.3% | 37.1% |
Let’s explore the characteristics of each of the four types of regime according to the EIU:
Full democracies are nations where:
- Civil liberties and fundamental political freedoms are respected
- Valid systems of governmental checks and balances exist
- There are limited problems in democratic functioning
- Media is diverse and independent
Flawed democracies are nations where:
- Elections are fair and free
- Basic liberties are honored but may have issues
- There are issues in the functioning of governance
Hybrid regimes are nations where:
- Electoral fraud or irregularities occur regularly
- Pressure is applied to political opposition
- Corruption is widespread and rule of law tends to be weak
- Media is pressured and harassed
- There are issues in the functioning of governance
Authoritarian regimes are nations where:
- Political pluralism is nonexistent or limited
- The population is ruled by absolute monarchies or dictatorships
- Infringements and abuses of civil liberties are common
- Elections are not fair or free (if they occur at all)
- Media is state-owned or controlled directly or indirectly by the ruling regime
- The judiciary system is not independent
- Criticism of the government is censored
Global Democracy Index by Region
As mentioned earlier, in 2021, the global democracy score declined from 5.37 to 5.28. This was driven by a decline in the average regional score, but every region has a different reality. Let’s take a look at the democratic state of each region in the world.
Americas
North America (Canada and U.S.) is the top-ranked region in the Democracy Index with an average score of 8.36, but this dropped significantly from 8.58 in 2020.
Both countries have dropped their positions in the global ranking, however, Canada still maintains the status as a full democracy.
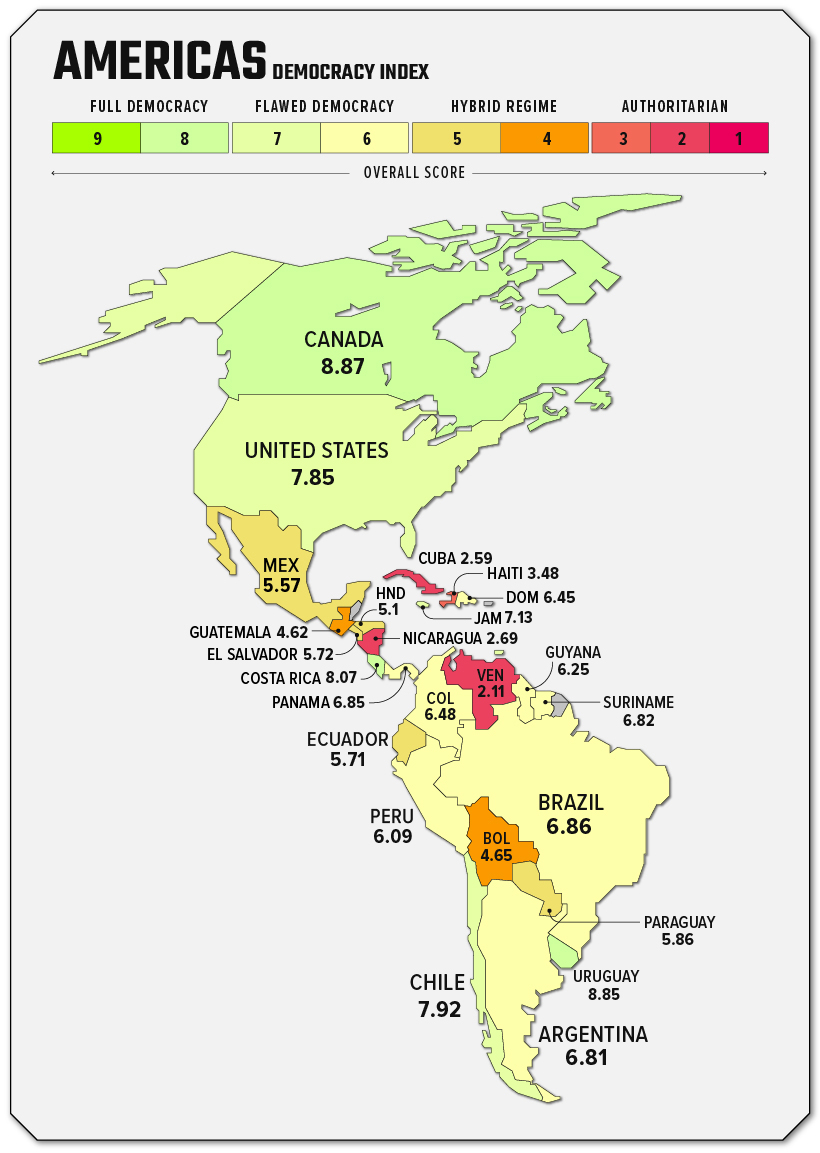
The U.S. is still classified by EIU as a flawed democracy, and has been since 2016. The report points to extreme polarization and “gerrymandering” as key issues facing the country. On the bright side, political participation in the U.S. is still very robust compared with the rest of the world.
Latin America and the Caribbean experienced the largest decline in regional scores in the world. This region dropped from 6.09 in 2020 to 5.83 in 2021. This decline shows the general discontent of the population about how their governments have handled the pandemic.
In this region, the only countries falling under the full democracy category are Costa Rica and Uruguay. On the other side of the spectrum, Venezuela, Nicaragua, and Cuba fall under the authoritarian regime classification.
Europe
In 2021, Western Europe is the region with the most full democracies in the world.
In fact, four out of the top five full democracies are in this region: Norway, Finland, Sweden, and Iceland. A notable downgrade in this region happened in Spain; the country is now considered a flawed democracy.
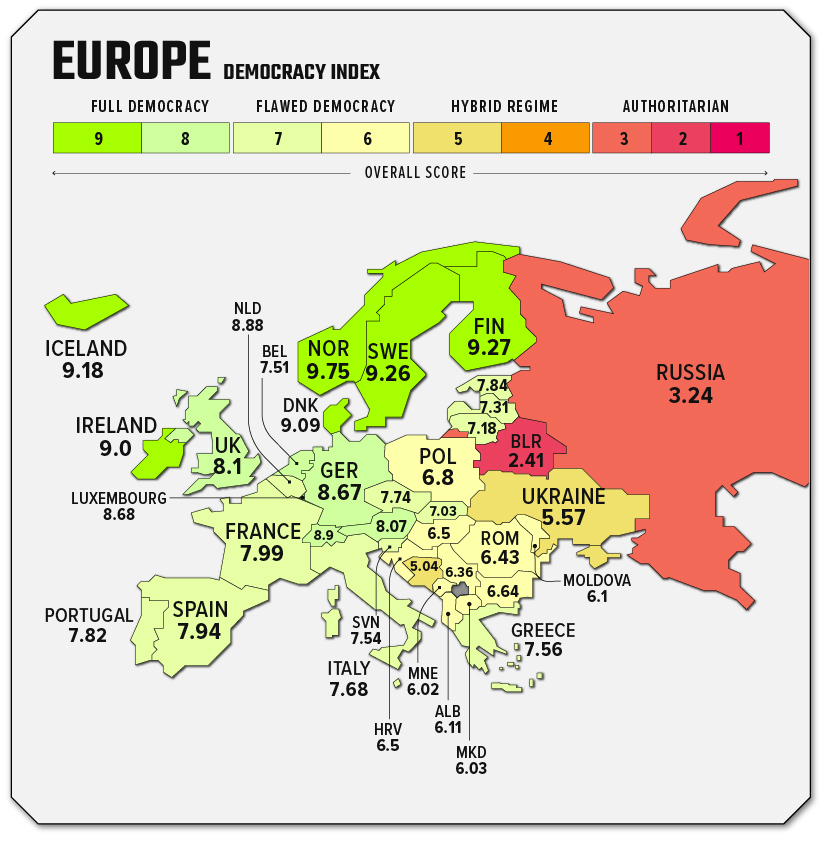
Eastern Europe paints a different picture, where there is not a single full democracy. Three countries (Moldova, Montenegro, and North Macedonia) were upgraded from being considered hybrid regimes to flawed democracies.
Ukraine’s score declined to 5.57, becoming a hybrid region. Russia’s score also declined to 3.24 keeping the authoritarian regime status. It’s important to note that this report by the EIU was published before the invasion of Ukraine began, and the conflict will almost certainly impact scores in next year’s report.
Africa
Sub-Saharan Africa has the most countries at the bottom of the Democracy Index rankings.
The fact is that 23 countries are considered “authoritarian regimes”. Meanwhile, there are 14 countries that are hybrid regimes, six countries under flawed democracy, and only one country, Mauritius, is considered a full democracy.
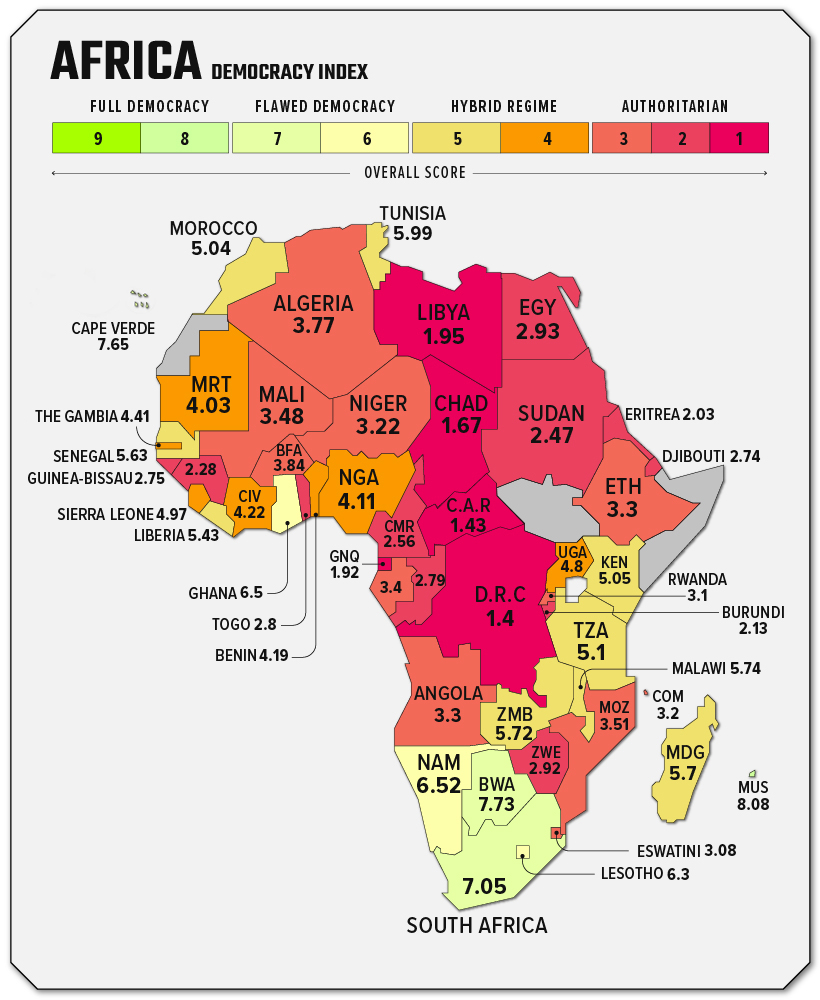
In North Africa, four countries are considered authoritarian regimes: Sudan, Egypt, Libya, and Algeria. Only Morocco and Tunisia fall into the hybrid regime classification.
Middle East and Central Asia
This region concentrates a substantial number of countries classified as authoritarian regimes. In fact, the region’s overall democracy score is now lower than what it was before the start of the Arab Spring in 2010.
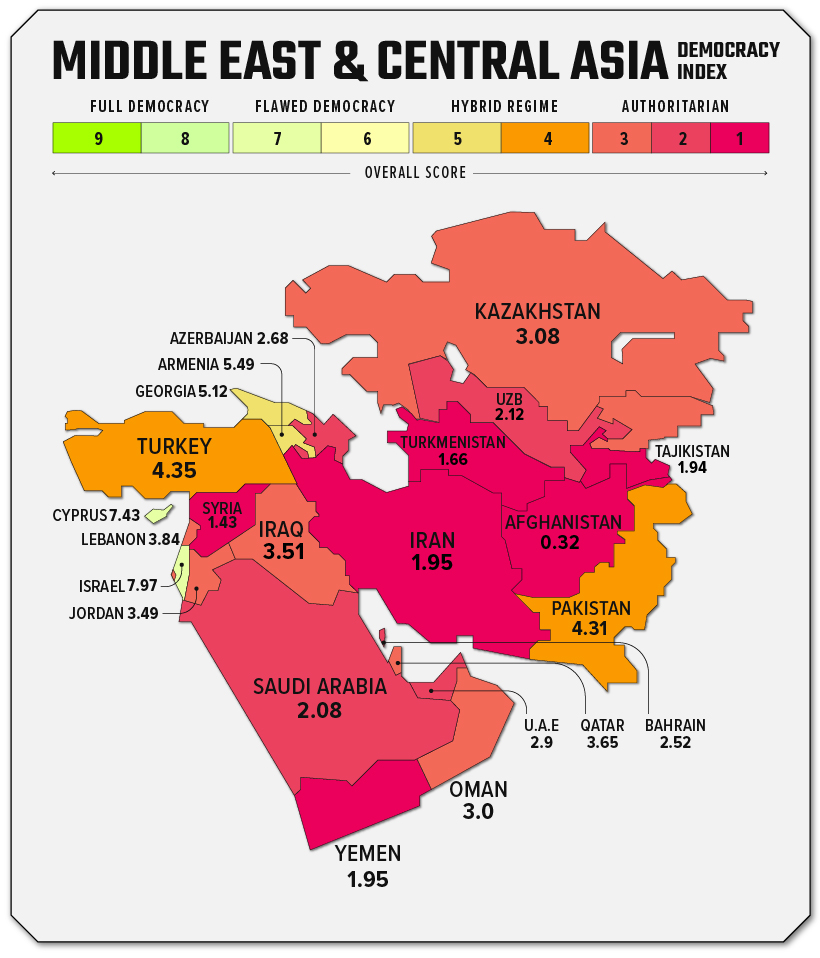
There are no countries falling under the category of full democracy in this region. Only Israel (7.97) and Cyprus (7.43) are considered flawed democracies. Turkey, Georgia, Armenia, and Pakistan fall under the category of hybrid regimes, and the rest of the countries in the region are considered authoritarian regimes.
East Asia and Oceania
This is broad region is full of contrasts. Aside from Western Europe, East Asia and Oceania contains the most full democracies: New Zealand, Taiwan, Australia, South Korea, and Japan. There are also a high number of countries that fall under the category of flawed democracies.
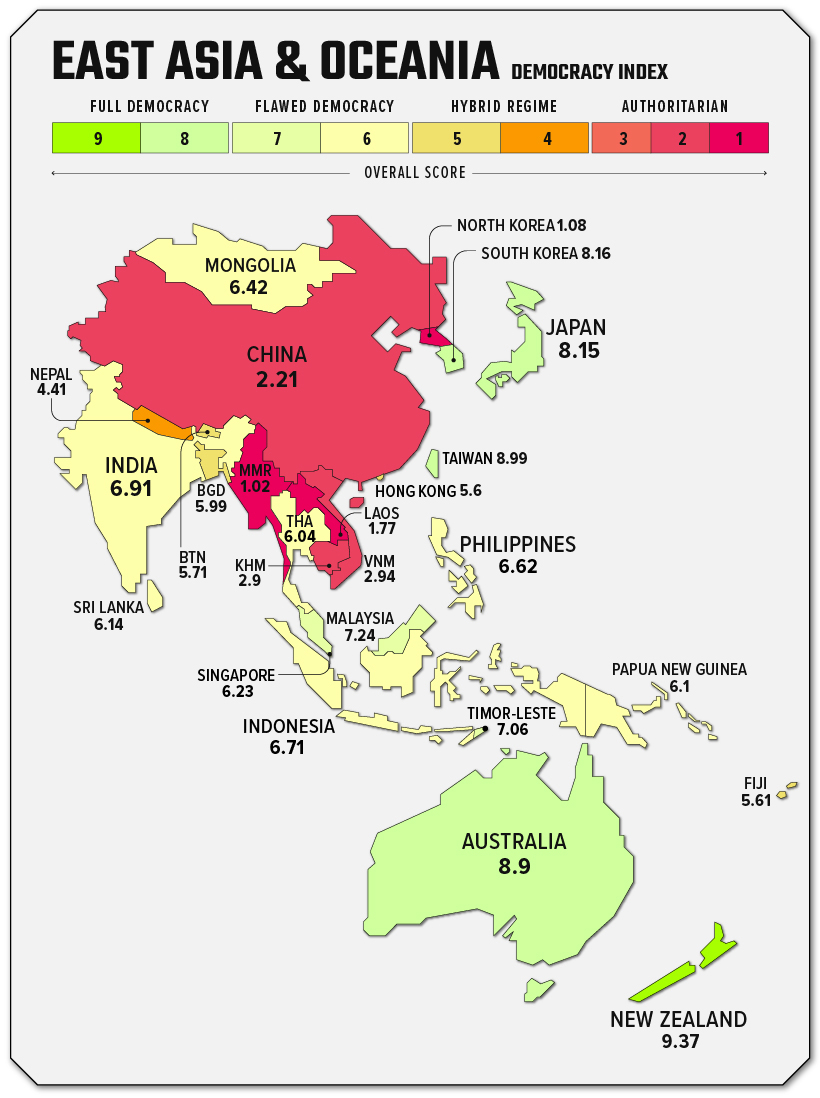
It’s worth noting that some of the most contentious geopolitical relationships are between neighbors with big differences in their scores: China and Taiwan, or North and South Korea are examples of this juxtaposition.
Decline in Global Democracy Levels
Two years after the world got hit by the pandemic, we can see that global democracy is in a downward trend.
Every region’s global score experienced a drop, with the exception of Western Europe, which remained flat. Out of the 167 countries, 74 (44%) experienced a decline in their democracy score.
As pandemic restrictions continue to be lifted, will democracy make a comeback in 2022?


Economy
The Bloc Effect: International Trade with Geopolitical Allies on the Rise
Rising geopolitical tensions are shaping the future of international trade, but what is the effect on trading among G7 and BRICS countries?


The Bloc Effect: International Trade with Allies on the Rise
International trade has become increasingly fragmented over the last five years as countries have shifted to trading more with their geopolitical allies.
This graphic from The Hinrich Foundation, the first in a three-part series covering the future of trade, provides visual context to the growing divide in trade in G7 and pre-expansion BRICS countries, which are used as proxies for geopolitical blocs.
Trade Shifts in G7 and BRICS Countries
This analysis uses IMF data to examine differences in shares of exports within and between trading blocs from 2018 to 2023. For example, we looked at the percentage of China’s exports with other BRICS members as well as with G7 members to see how these proportions shifted in percentage points (pp) over time.
Countries traded nearly $270 billion more with allies in 2023 compared to 2018. This shift came at the expense of trade with rival blocs, which saw a decline of $314 billion.
Country Change in Exports Within Bloc (pp) Change in Exports With Other Bloc (pp)
🇮🇳 India 0.0 3.9
🇷🇺 Russia 0.7 -3.8
🇮🇹 Italy 0.8 -0.7
🇨🇦 Canada 0.9 -0.7
🇫🇷 France 1.0 -1.1
🇪🇺 EU 1.1 -1.5
🇩🇪 Germany 1.4 -2.1
🇿🇦 South Africa 1.5 1.5
🇺🇸 U.S. 1.6 -0.4
🇯🇵 Japan 2.0 -1.7
🇨🇳 China 2.1 -5.2
🇧🇷 Brazil 3.7 -3.3
🇬🇧 UK 10.2 0.5
All shifts reported are in percentage points. For example, the EU saw its share of exports to G7 countries rise from 74.3% in 2018 to 75.4% in 2023, which equates to a 1.1 percentage point increase.
The UK saw the largest uptick in trading with other countries within the G7 (+10.2 percentage points), namely the EU, as the post-Brexit trade slump to the region recovered.
Meanwhile, the U.S.-China trade dispute caused China’s share of exports to the G7 to fall by 5.2 percentage points from 2018 to 2023, the largest decline in our sample set. In fact, partly as a result of the conflict, the U.S. has by far the highest number of harmful tariffs in place.
The Russia-Ukraine War and ensuing sanctions by the West contributed to Russia’s share of exports to the G7 falling by 3.8 percentage points over the same timeframe.
India, South Africa, and the UK bucked the trend and continued to witness advances in exports with the opposing bloc.
Average Trade Shifts of G7 and BRICS Blocs
Though results varied significantly on a country-by-country basis, the broader trend towards favoring geopolitical allies in international trade is clear.
Bloc Change in Exports Within Bloc (pp) Change in Exports With Other Bloc (pp)
Average 2.1 -1.1
BRICS 1.6 -1.4
G7 incl. EU 2.4 -1.0
Overall, BRICS countries saw a larger shift away from exports with the other bloc, while for G7 countries the shift within their own bloc was more pronounced. This implies that though BRICS countries are trading less with the G7, they are relying more on trade partners outside their bloc to make up for the lost G7 share.
A Global Shift in International Trade and Geopolitical Proximity
The movement towards strengthening trade relations based on geopolitical proximity is a global trend.
The United Nations categorizes countries along a scale of geopolitical proximity based on UN voting records.
According to the organization’s analysis, international trade between geopolitically close countries rose from the first quarter of 2022 (when Russia first invaded Ukraine) to the third quarter of 2023 by over 6%. Conversely, trade with geopolitically distant countries declined.
The second piece in this series will explore China’s gradual move away from using the U.S. dollar in trade settlements.
Visit the Hinrich Foundation to learn more about the future of geopolitical trade

-

 Economy1 day ago
Economic Growth Forecasts for G7 and BRICS Countries in 2024
The IMF has released its economic growth forecasts for 2024. How do the G7 and BRICS countries compare?
-

 United States1 week ago
Ranked: The Largest U.S. Corporations by Number of Employees
We visualized the top U.S. companies by employees, revealing the massive scale of retailers like Walmart, Target, and Home Depot.
-

 Economy2 weeks ago
Where U.S. Inflation Hit the Hardest in March 2024
We visualized product categories that saw the highest % increase in price due to U.S. inflation as of March 2024.
-

 Economy4 weeks ago
G20 Inflation Rates: Feb 2024 vs COVID Peak
We visualize inflation rates across G20 countries as of Feb 2024, in the context of their COVID-19 pandemic peak.
-

 Economy1 month ago
Mapped: Unemployment Claims by State
This visual heatmap of unemployment claims by state highlights New York, California, and Alaska leading the country by a wide margin.
-

 Economy2 months ago
Confidence in the Global Economy, by Country
Will the global economy be stronger in 2024 than in 2023?


-

 Mining1 week ago
Gold vs. S&P 500: Which Has Grown More Over Five Years?
-

 Markets2 weeks ago
Ranked: The Most Valuable Housing Markets in America
-

 Money2 weeks ago
Which States Have the Highest Minimum Wage in America?
-

 AI2 weeks ago
Ranked: Semiconductor Companies by Industry Revenue Share
-

 Markets2 weeks ago
Ranked: The World’s Top Flight Routes, by Revenue
-

 Countries2 weeks ago
Population Projections: The World’s 6 Largest Countries in 2075
-

 Markets2 weeks ago
The Top 10 States by Real GDP Growth in 2023
-

 Demographics2 weeks ago
The Smallest Gender Wage Gaps in OECD Countries