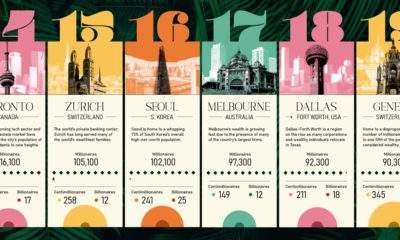

This ranking of the world's wealthiest cities leverages a robust data set that tracks the location and net worth of ultra-wealthy individuals
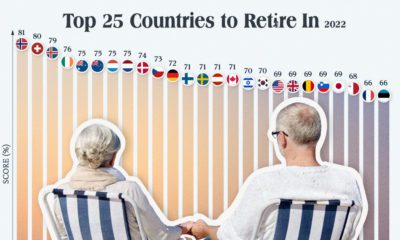

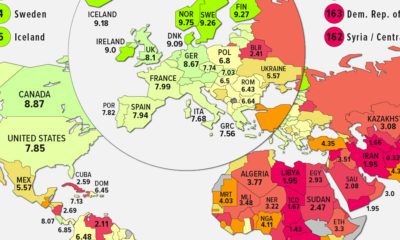
Which countries are the best equipped to support their aging population? This graphic show the best countries to retire in around the world.
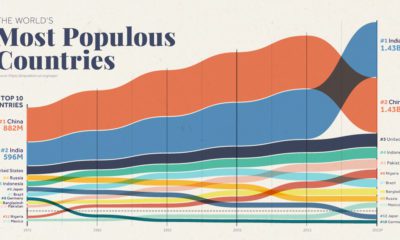

Over the past 50 years, the world's population has doubled, and there have been big changes in the ranking of the world's most populous countries
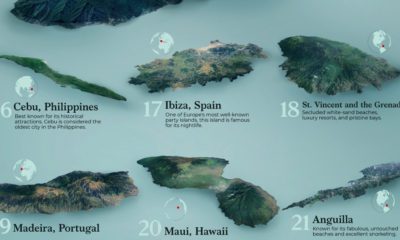

This graphic uses survey data from Travel + Leisure magazine to show the 25 best islands to visit around the world.
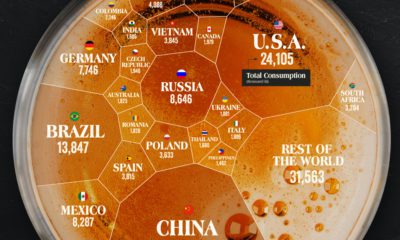

Which countries drink the most beer? China ranks number one due to its sheer size, and the Czech Republic comes out on top, per capita.
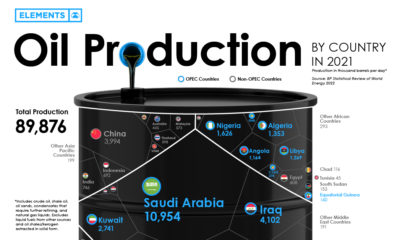

Global oil production averaged 89.8 million barrels of oil per day in 2021. Here are the world's largest oil producers.
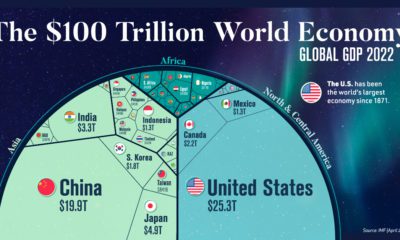

Despite ripple effects from conflict and inflation, global growth continues. According to the IMF, the global GDP will hit $104 trillion by end of year.
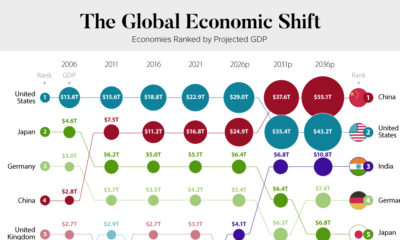

Over the next decade, China is expected to surpass the U.S. in economic power, and India is primed to become the world's third-largest economy.
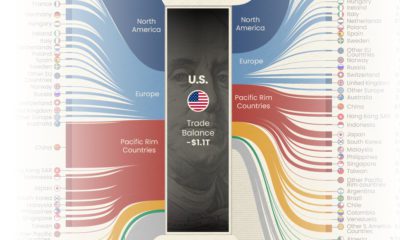

U.S. trade of goods amounted to nearly $4.6 trillion in 2021, and Canada, Mexico, and China were the country's biggest trading partners.
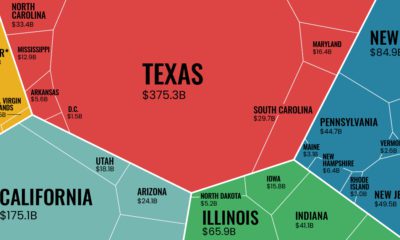

The U.S. exported $1.8 trillion worth of goods in 2021. This infographic looks at where that trade activity took place across the nation.


China’s economy reached a GDP of 114 trillion yuan ($18 trillion) in 2021, well above government targets. What sectors drove that growth?

We map the state of global democracy, as the Democracy Index hits its lowest point since the inception of the index in 2006.
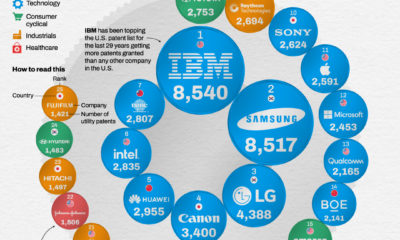

Companies around the world invest billions in R&D to provide cutting-edge innovation to their products and services.
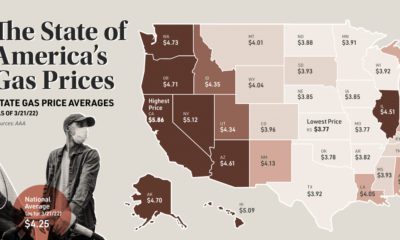

This map looks at gas prices across various states, and historical context for today's sky-high prices at the pump.
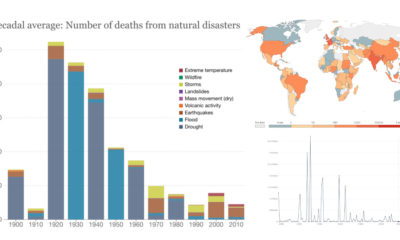

This interactive dashboard, which covers over a century of data on natural disasters, shows a declining global death toll over time.
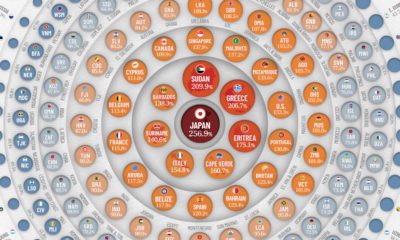

Global debt reached $226T by the end of 2020 – the biggest one-year jump since WWII. This graphic compares the debt-to-GDP ratio of various countries.
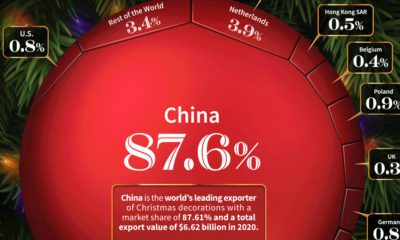

Billions of dollars worth of Christmas decorations are exported around the world each year. Here are the countries that exports the most.
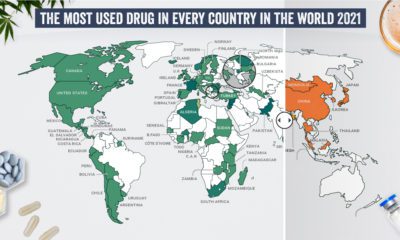

What are the most commonly used illicit drugs around the world?
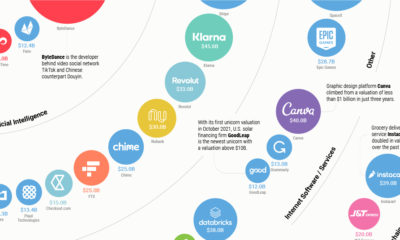

Here are the world’s biggest startups with a valuation above $10 billion.
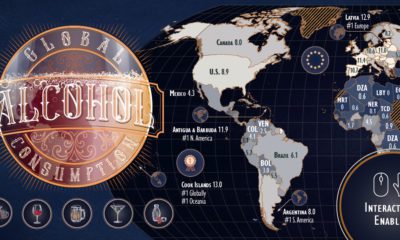

Which countries are the world's biggest alcohol drinkers? This interactive map explores global alcohol consumption per capita.
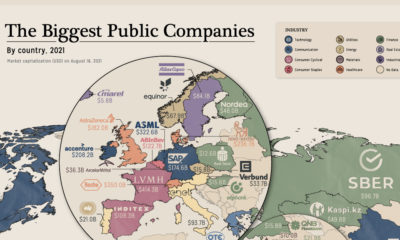

Tech, finance or energy giant? We mapped the biggest companies by market cap and industry.
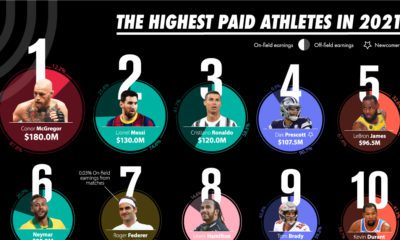

Athletes pull huge sums of money from their on-field and off-field contracts. Here we rank the top 50 highest-paid athletes in the world.
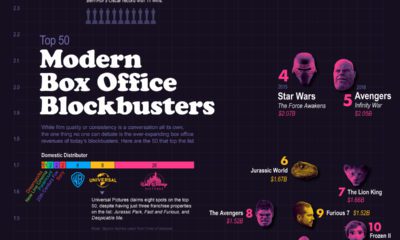

It's hard to measure the quality of a film—gauging its popularity is a lot easier. Here's a list of the top grossing movies in the last...
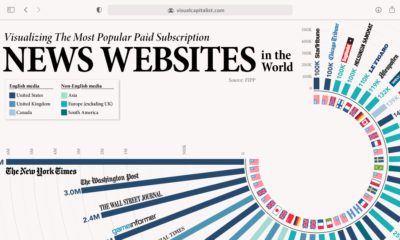

Many consumers are reluctant to pay for their news, but those that do turn to trusted sources. Here's a look at the most subscribed to news...
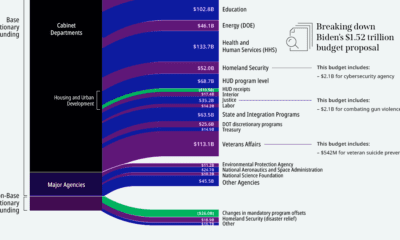

A breakdown of President Biden’s budget proposal for 2022. Climate change initiatives, cybersecurity, and additional social programs are key areas of focus.
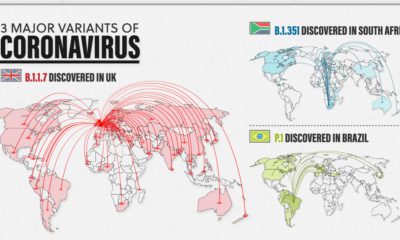

New variants of COVID-19 are spreading fast around the world. Here’s a look at the 3 major ones and how they differ from one another.
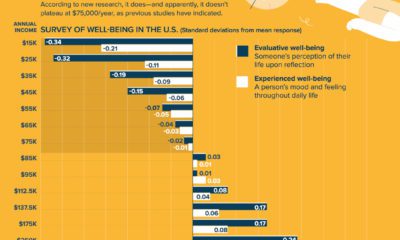

We’ve heard that money can only buy happiness up to a certain point. But a new study suggests cut-off may be a lot higher than we...
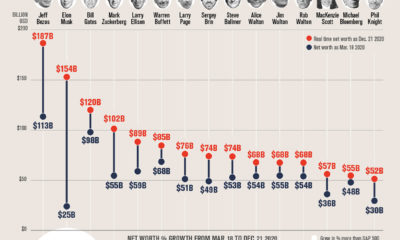

The net worth of some American Billionaires has grown substantially since the COVID-19 market bottom. Here's how much their fortunes grew.


 Creator Program