Personal Finance
Ranked: The Best Countries to Retire In


Ranked: The Best Countries to Retire in Around the World
Our global population is getting older. By 2050, the OECD predicts that 30% of people worldwide will be aged 65 or over.
While some countries are relatively prepared to handle this increase in the elderly demographic, others are already feeling the squeeze and struggling with the challenges that come with a rapidly aging population.
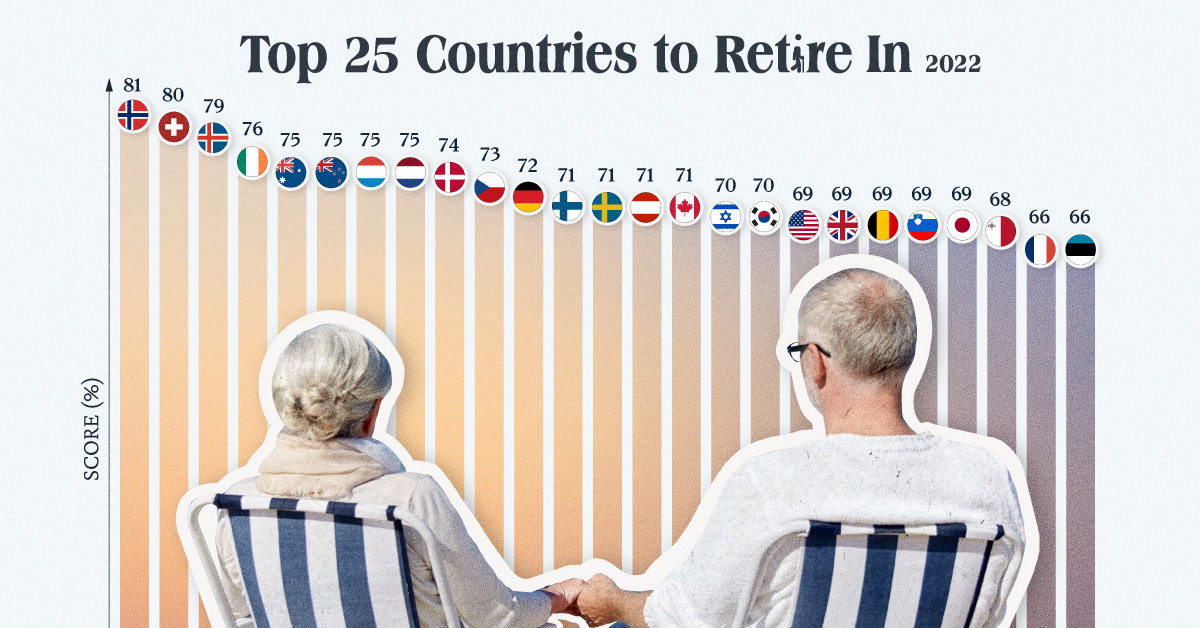
Which countries are the best equipped to support their senior citizens? This graphic uses data from the 2022 Natixis Global Retirement Index to show the best countries to retire in around the world, based on several different factors that we’ll dig into below.
What Makes a Country Retirement-Friendly?
When people consider what makes a place an ideal retirement location, it’s natural to think about white sand beaches, hot climates, and endless sunny days. And, in truth, the right net worth opens up a world of opportunity of where to enjoy one’s golden years.
The Global Retirement Index (GRI) examines retirement from different, more quantitative perspective. The annual report looks at 44 different countries and ranks them based on their retirement security. The index considers 18 factors, which are grouped into four overarching categories:
- Health: Health spend per capita, life expectancy, and non-insured health spend.
- Quality of Life: Happiness levels, water and sanitation, air quality, other environmental factors, and biodiversity/habitat.
- Material Wellbeing: Income per capita, income equality, and employment levels.
- Finances in Retirement: Government debt, old-age dependency, interest rates, inflation, governance, tax pressure, and bank non-performing loans.
Using these 18 metrics, a score from 0.01 to 1 is determined for each country, which is then converted to a percentage. For a more detailed explanation of the report’s methodology, explore Appendix A (page 72) of the report.
The Top 25 Best Countries to Retire in
With an overall score of 81%, Norway comes in at number one as the most retirement-friendly country on the list.
| Rank | Country | Score | Health | Quality of Life | Material Wellbeing | Finances in Retirement |
|---|---|---|---|---|---|---|
| 1 | 🇳🇴 Norway | 81% | 91% | 87% | 79% | 69% |
| 2 | 🇨🇭 Switzerland | 80% | 90% | 86% | 69% | 74% |
| 3 | 🇮🇸 Iceland | 79% | 88% | 86% | 77% | 68% |
| 4 | 🇮🇪 Ireland | 76% | 89% | 80% | 67% | 70% |
| 5 | 🇦🇺 Australia | 75% | 88% | 77% | 66% | 72% |
| 6 | 🇳🇿 New Zealand | 75% | 85% | 81% | 64% | 71% |
| 7 | 🇱🇺 Luxembourg | 75% | 91% | 81% | 72% | 59% |
| 8 | 🇳🇱 Netherlands | 75% | 89% | 80% | 78% | 56% |
| 9 | 🇩🇰 Denmark | 74% | 86% | 88% | 76% | 54% |
| 10 | 🇨🇿 Czech Republic | 73% | 76% | 68% | 84% | 64% |
| 11 | 🇩🇪 Germany | 72% | 87% | 80% | 71% | 55% |
| 12 | 🇫🇮 Finland | 71% | 84% | 89% | 63% | 55% |
| 13 | 🇸🇪 Sweden | 71% | 90% | 87% | 59% | 56% |
| 14 | 🇦🇹 Austria | 71% | 86% | 82% | 69% | 54% |
| 15 | 🇨🇦 Canada | 71% | 87% | 74% | 58% | 67% |
| 16 | 🇮🇱 Israel | 70% | 82% | 74% | 60% | 66% |
| 17 | 🇰🇷 South Korea | 70% | 80% | 59% | 68% | 73% |
| 18 | 🇺🇸 United States | 69% | 85% | 72% | 56% | 67% |
| 19 | 🇬🇧 United Kingdom | 69% | 83% | 82% | 61% | 55% |
| 20 | 🇧🇪 Belgium | 69% | 85% | 74% | 70% | 51% |
| 21 | 🇸🇮 Slovenia | 69% | 82% | 69% | 77% | 51% |
| 22 | 🇯🇵 Japan | 69% | 91% | 67% | 72% | 51% |
| 23 | 🇲🇹 Malta | 68% | 78% | 61% | 72% | 63% |
| 24 | 🇫🇷 France | 66% | 90% | 78% | 57% | 48% |
| 25 | 🇪🇪 Estonia | 66% | 68% | 68% | 60% | 68% |
Norway is at the top of this year’s ranking for several reasons. For starters, it achieved the highest score in the Health category, largely because of its high average life expectancy, which is 83 years old, or 9 years longer than the global average.
Norway also has the highest score of all the countries for Governance, a category gauged by assessing country corruption levels, political stability, and government effectiveness, and is in a three-way tie with Japan and Luxembourg in the Health category.
Second on the list is another European country, Switzerland, with an overall score of 80%. It’s the highest-ranked country for environmental factors, and it also has the highest overall score in the Finances in Retirement category.
A Regional Breakdown
While European countries dominate the top 10 in the ranking, how does Europe rank as a region as a whole? Before diving in, it’s important to note that the study actually breaks up Europe into two sections: Eastern Europe (grouped with Central Asia) and Western Europe.
| Rank | Region | Overall Score |
|---|---|---|
| 1 | North America | 69% |
| 2 | Western Europe | 66% |
| 3 | Eastern Europe and Central Asia | 49% |
| 4 | Latin America | 37% |
| 5 | Asia Pacific | 32% |
And from a regional perspective, North America comes in first place despite the fact no countries in the region made it into the top 10. North America only has two countries included in the ranking: Canada (#15) and the U.S. (#18), which both rank relatively high.
In contrast, Western and Eastern Europe have more countries to account for, which ultimately lowers their regional average.
The Future of Retirement
As longevity rises and the retirement aged population continues to increase worldwide, many countries are opting to change their pension policies in an effort to encourage people to stay in the workforce longer.
For instance, in 2018, people in the UK could claim their State Pension once they turned 65. By 2028, this age requirement will be raised to 67.
However, government intervention may not be necessary, as many people around the world are already staying in the workforce beyond the traditional retirement age (perhaps more out of necessity than choice).


Personal Finance
Chart: The Declining Value of the U.S. Federal Minimum Wage
This graphic compares the nominal vs. inflation-adjusted value of the U.S. minimum wage, from 1940 to 2023.


The Declining Value of the U.S. Federal Minimum Wage
This was originally posted on our Voronoi app. Download the app for free on iOS or Android and discover incredible data-driven charts from a variety of trusted sources.
This graphic illustrates the history of the U.S. federal minimum wage using data compiled by Statista, in both nominal and real (inflation-adjusted) terms. The federal minimum wage was raised to $7.25 per hour in July 2009, where it has remained ever since.
Nominal vs. Real Value
The data we used to create this graphic can be found in the table below.
| Year | Nominal value ($/hour) | Real value ($/hour) |
|---|---|---|
| 1940 | 0.3 | 6.5 |
| 1945 | 0.4 | 6.82 |
| 1950 | 0.75 | 9.64 |
| 1955 | 0.75 | 8.52 |
| 1960 | 1 | 10.28 |
| 1965 | 1.25 | 12.08 |
| 1970 | 1.6 | 12.61 |
| 1975 | 2.1 | 12.04 |
| 1980 | 3.1 | 11.61 |
| 1985 | 3.35 | 9.51 |
| 1990 | 3.8 | 8.94 |
| 1995 | 4.25 | 8.49 |
| 2000 | 5.15 | 9.12 |
| 2005 | 5.15 | 8.03 |
| 2010 | 7.25 | 10.09 |
| 2015 | 7.25 | 9.3 |
| 2018 | 7.25 | 8.78 |
| 2019 | 7.25 | 8.61 |
| 2020 | 7.25 | 8.58 |
| 2021 | 7.25 | 8.24 |
| 2022 | 7.25 | 7.61 |
| 2023 | 7.25 | 7.25 |
What our graphic shows is how inflation has eroded the real value of the U.S. minimum wage over time, despite nominal increases.
For instance, consider the year 1960, when the federal minimum wage was $1 per hour. After accounting for inflation, this would be worth around $10.28 today!
The two lines converge at 2023 because the nominal and real value are identical in present day terms.
Many States Have Their Own Minimum Wage
According to the National Conference of State Legislatures (NCSL), 30 states and Washington, D.C. have implemented a minimum wage that is higher than $7.25.
The following states have adopted the federal minimum: Georgia, Idaho, Indiana, Iowa, Kansas, Kentucky, New Hampshire, North Carolina, North Dakota, Oklahoma, Pennsylvania, Texas, Utah, Wisconsin, and Wyoming.
Meanwhile, the states of Alabama, Louisiana, Mississippi, South Carolina, and Tennessee have no wage minimums, but have to follow the federal minimum.
How Does the U.S. Minimum Wage Rank Globally?
If you found this topic interesting, check out Mapped: Minimum Wage Around the World to see which countries have the highest minimum wage in monthly terms, as of January 2023.

-

 Science1 week ago
Visualizing the Average Lifespans of Mammals
-

 Demographics2 weeks ago
The Smallest Gender Wage Gaps in OECD Countries
-

 United States2 weeks ago
Where U.S. Inflation Hit the Hardest in March 2024
-

 Green2 weeks ago
Top Countries By Forest Growth Since 2001
-

 United States2 weeks ago
Ranked: The Largest U.S. Corporations by Number of Employees
-

 Maps2 weeks ago
The Largest Earthquakes in the New York Area (1970-2024)
-

 Green2 weeks ago
Ranked: The Countries With the Most Air Pollution in 2023
-

 Green2 weeks ago
Ranking the Top 15 Countries by Carbon Tax Revenue