Energy
Mapped: Gas Prices in America at All-Time Highs
Gas Prices in America at All-Time High
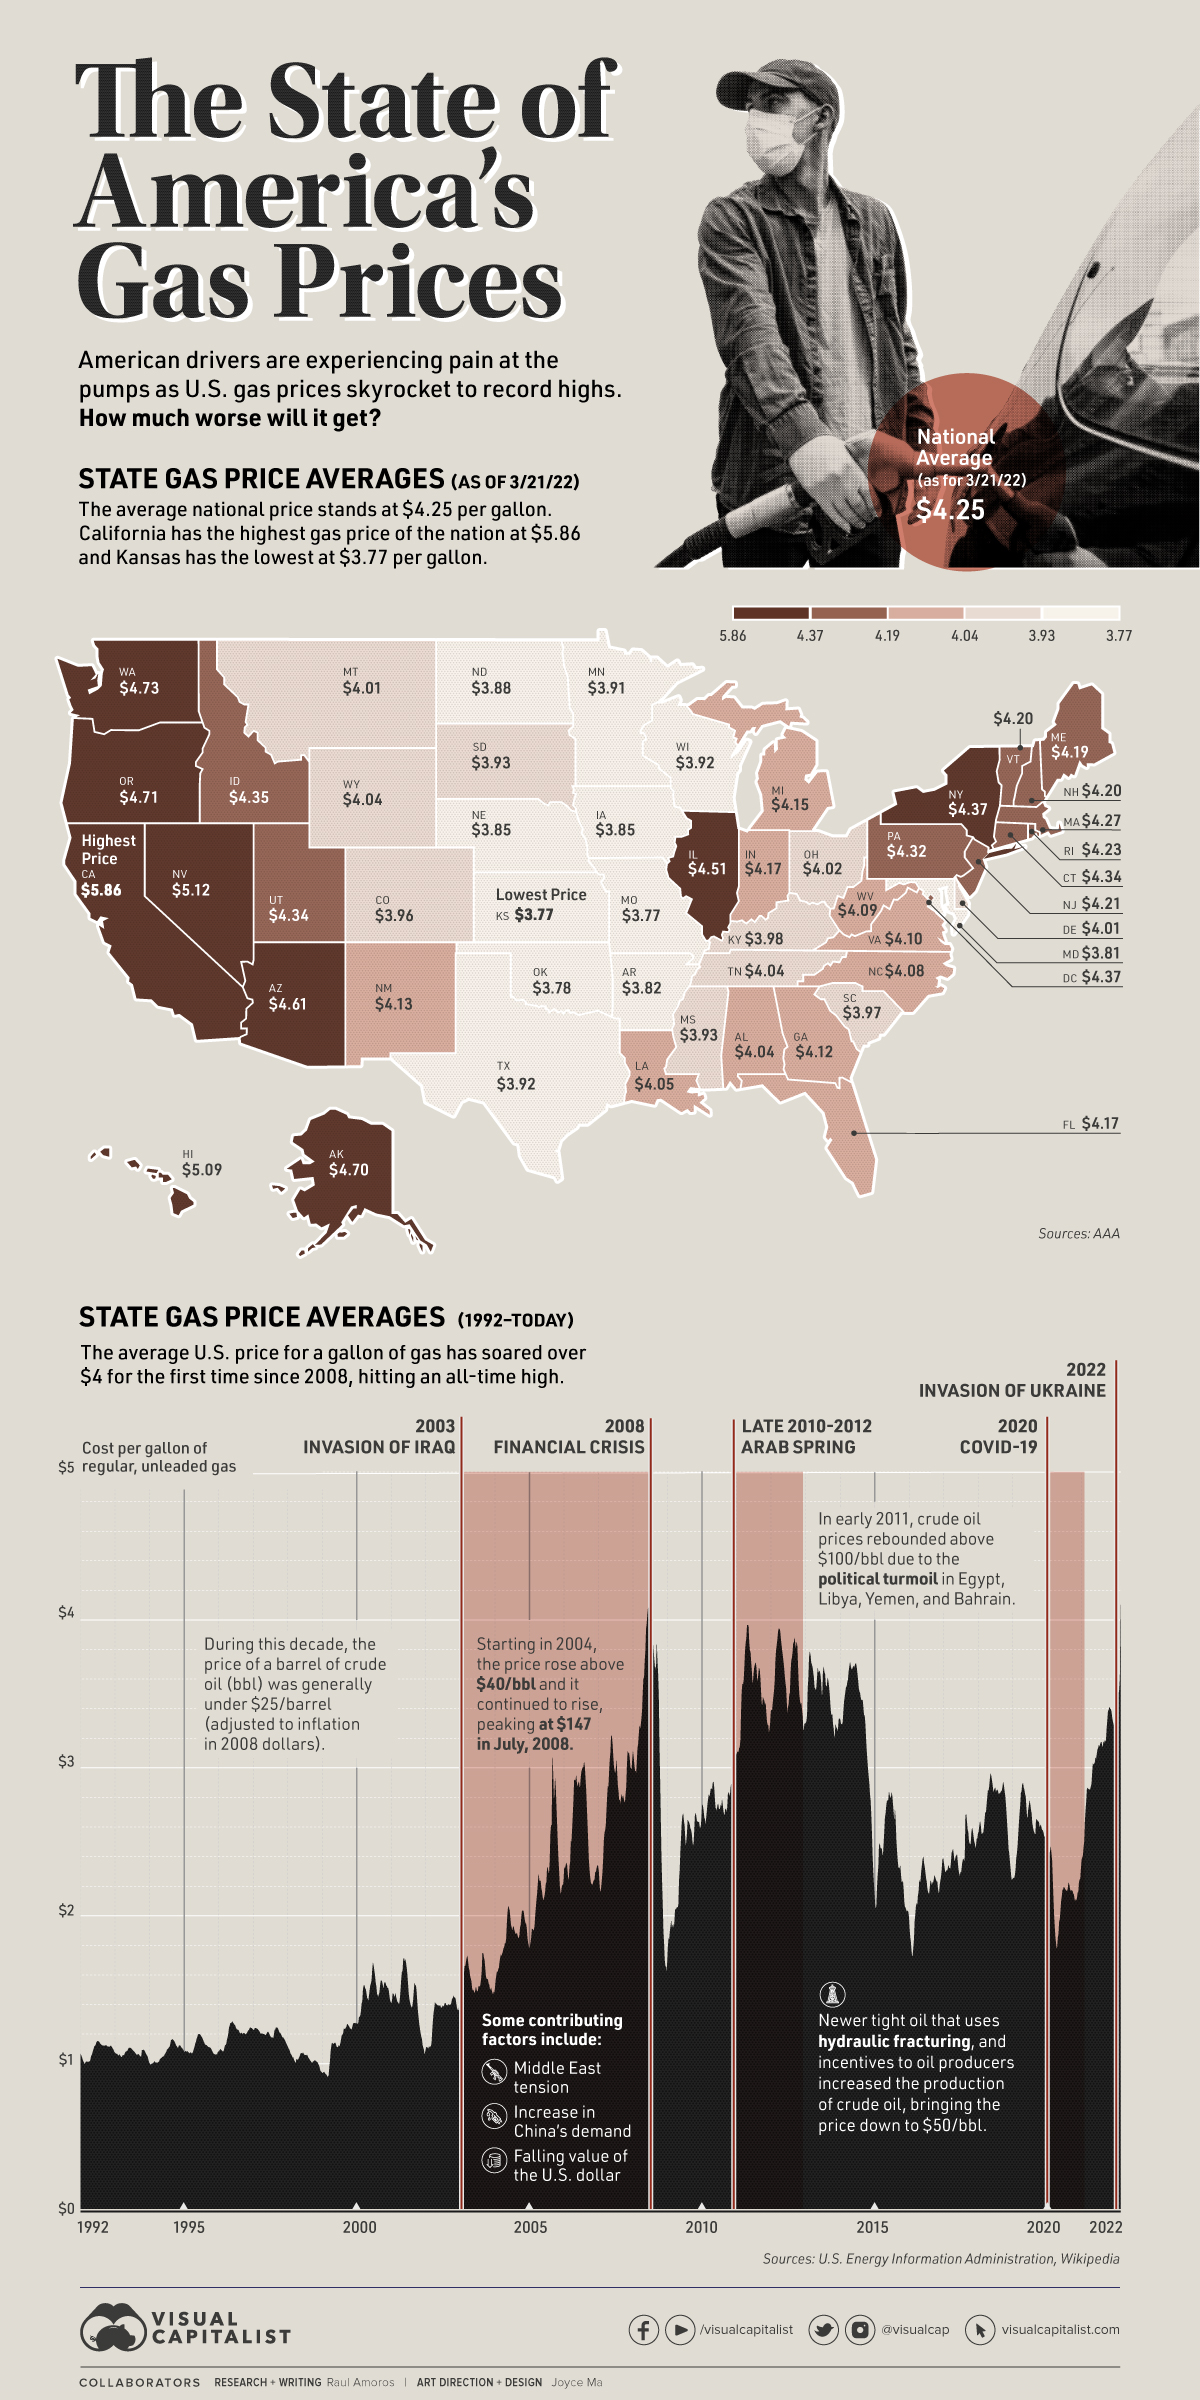
In recent days, gas prices have skyrocketed to all-time highs.
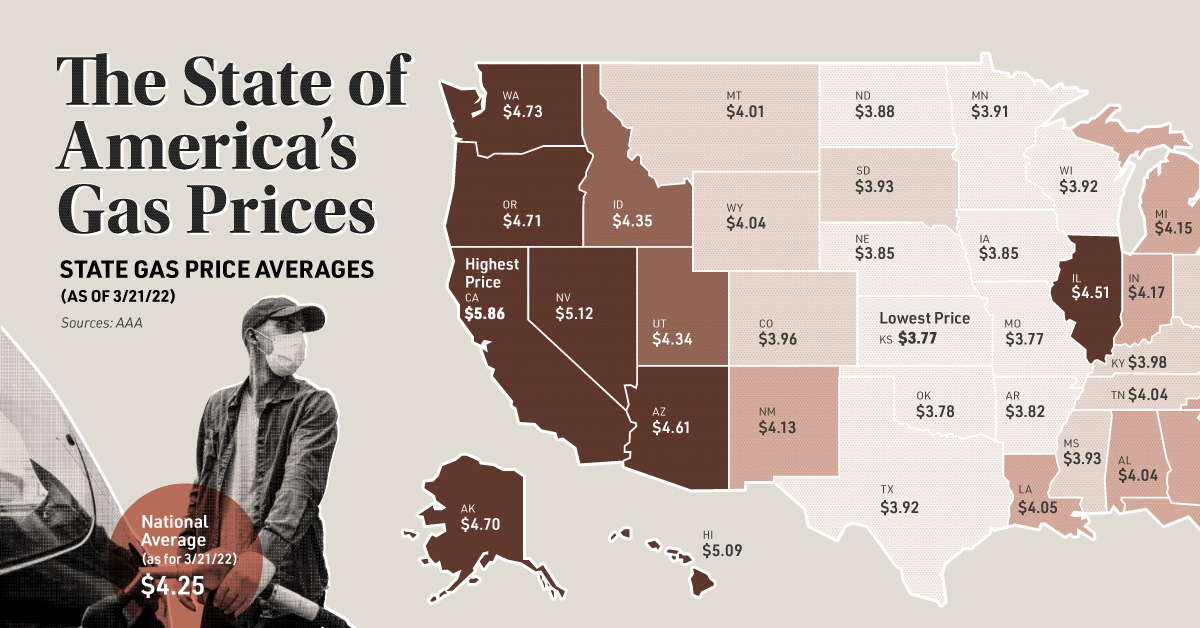
According to the American Automobile Association (AAA), the national average price of regular unleaded gas has reached $4.25 per gallon as of March 21st, 2022. This is the first time since 2008 that gas prices had exceeded the $4 per gallon mark.
The price of gas was already rising two weeks before the Russian invasion of Ukraine, owing to the increased demand due to the lifting of COVID restrictions. But when the war broke out, the price of regular gas jumped 41¢ during the first week. This surge in prices could add up to $2,000 in annual cost to the average American household.
While the price at the pump sits at $4.25 per gallon on average, it’s worth mentioning that prices range quite substantially depending on the state. California has the highest average price at $5.86 per gallon. On the other extreme, Kansas has an average price of $3.77 per gallon.
Where is Gas the Most Expensive in America?
There are eight states where gas prices are above $4.50 per gallon, and three states where the price is above $5: California, Hawaii, and Nevada.
Here are the 10 states or districts with the highest gas prices:
| Rank | State | Cost per Gallon (as of 03/21/2022) |
|---|---|---|
| #1 | California | $5.855 |
| #2 | Nevada | $5.118 |
| #3 | Hawaii | $5.087 |
| #4 | Washington | $4.726 |
| #5 | Oregon | $4.708 |
| #6 | Alaska | $4.699 |
| #7 | Arizona | $4.613 |
| #8 | Illinois | $4.506 |
| #9 | New York | $4.368 |
| #10 | District of Columbia | $4.367 |
Where is Gas the Least Expensive in America?
There are 16 states where gas prices are under $4 per gallon. Here are the 10 states with the lowest gas prices:
| Rank | State | Cost per Gallon (as of 03/21/2022) |
|---|---|---|
| #1 | Kansas | $3.767 |
| #2 | Missouri | $3.773 |
| #3 | Oklahoma | $3.775 |
| #9 | Maryland | $3.811 |
| #5 | Arkansas | $3.822 |
| #6 | Nebraska | $3.848 |
| #7 | Iowa | $3.854 |
| #8 | North Dakota | $3.882 |
| #9 | Minnesota | $3.914 |
| #10 | Texas | $3.918 |
There are a few reasons why gas prices can vary from state to state. State taxes play a big role in the final price at the pump, and they can range from 57.6¢ per gallon in Pennsylvania to 8¢ per gallon in Alaska.
Proximity to refineries is another contributing factor for cheaper gas. States like Texas, Louisiana, Mississippi, and Alabama often have lower prices than other regions.
When Will Gas Prices Go Down?
Gas prices were on the rise due to an oil supply shortage. When war broke out, there was an additional price surge due to sanctions or bans on Russian oil exports by the West.
It’s also worth noting that even as the price of oil begins to fall once again, there is typically a lag before prices at the pump begin to ease for consumers.
The Energy Information Administration projects that average spot price of Brent crude oil will be $105.22 per barrel this year, a $22 difference compared to its original February forecast. As a result, many experts are expecting that gas prices could stay near or above $4 per gallon for the rest of the year.


Energy
Charted: 4 Reasons Why Lithium Could Be the Next Gold Rush
Visual Capitalist has partnered with EnergyX to show why drops in prices and growing demand may make now the right time to invest in lithium.


4 Reasons Why You Should Invest in Lithium
Lithium’s importance in powering EVs makes it a linchpin of the clean energy transition and one of the world’s most precious minerals.
In this graphic, Visual Capitalist partnered with EnergyX to explore why now may be the time to invest in lithium.
1. Lithium Prices Have Dropped
One of the most critical aspects of evaluating an investment is ensuring that the asset’s value is higher than its price would indicate. Lithium is integral to powering EVs, and, prices have fallen fast over the last year:
| Date | LiOH·H₂O* | Li₂CO₃** |
|---|---|---|
| Feb 2023 | $76 | $71 |
| March 2023 | $71 | $61 |
| Apr 2023 | $43 | $33 |
| May 2023 | $43 | $33 |
| June 2023 | $47 | $45 |
| July 2023 | $44 | $40 |
| Aug 2023 | $35 | $35 |
| Sept 2023 | $28 | $27 |
| Oct 2023 | $24 | $23 |
| Nov 2023 | $21 | $21 |
| Dec 2023 | $17 | $16 |
| Jan 2024 | $14 | $15 |
| Feb 2024 | $13 | $14 |
Note: Monthly spot prices were taken as close to the 14th of each month as possible.
*Lithium hydroxide monohydrate MB-LI-0033
**Lithium carbonate MB-LI-0029
2. Lithium-Ion Battery Prices Are Also Falling
The drop in lithium prices is just one reason to invest in the metal. Increasing economies of scale, coupled with low commodity prices, have caused the cost of lithium-ion batteries to drop significantly as well.
In fact, BNEF reports that between 2013 and 2023, the price of a Li-ion battery dropped by 82%.
| Year | Price per KWh |
|---|---|
| 2023 | $139 |
| 2022 | $161 |
| 2021 | $150 |
| 2020 | $160 |
| 2019 | $183 |
| 2018 | $211 |
| 2017 | $258 |
| 2016 | $345 |
| 2015 | $448 |
| 2014 | $692 |
| 2013 | $780 |

3. EV Adoption is Sustainable
One of the best reasons to invest in lithium is that EVs, one of the main drivers behind the demand for lithium, have reached a price point similar to that of traditional vehicle.
According to the Kelly Blue Book, Tesla’s average transaction price dropped by 25% between 2022 and 2023, bringing it in line with many other major manufacturers and showing that EVs are a realistic transport option from a consumer price perspective.
| Manufacturer | September 2022 | September 2023 |
|---|---|---|
| BMW | $69,000 | $72,000 |
| Ford | $54,000 | $56,000 |
| Volkswagon | $54,000 | $56,000 |
| General Motors | $52,000 | $53,000 |
| Tesla | $68,000 | $51,000 |
4. Electricity Demand in Transport is Growing
As EVs become an accessible transport option, there’s an investment opportunity in lithium. But possibly the best reason to invest in lithium is that the IEA reports global demand for the electricity in transport could grow dramatically by 2030:
| Transport Type | 2022 | 2025 | 2030 |
|---|---|---|---|
| Buses 🚌 | 23,000 GWh | 50,000 GWh | 130,000 GWh |
| Cars 🚙 | 65,000 GWh | 200,000 GWh | 570,000 GWh |
| Trucks 🛻 | 4,000 GWh | 15,000 GWh | 94,000 GWh |
| Vans 🚐 | 6,000 GWh | 16,000 GWh | 72,000 GWh |
The Lithium Investment Opportunity
Lithium presents a potentially classic investment opportunity. Lithium and battery prices have dropped significantly, and recently, EVs have reached a price point similar to other vehicles. By 2030, the demand for clean energy, especially in transport, will grow dramatically.
With prices dropping and demand skyrocketing, now is the time to invest in lithium.
EnergyX is poised to exploit lithium demand with cutting-edge lithium extraction technology capable of extracting 300% more lithium than current processes.

-

 Lithium4 days ago
Ranked: The Top 10 EV Battery Manufacturers in 2023
Asia dominates this ranking of the world’s largest EV battery manufacturers in 2023.
-

 Energy1 week ago
The World’s Biggest Nuclear Energy Producers
China has grown its nuclear capacity over the last decade, now ranking second on the list of top nuclear energy producers.
-

 Energy1 month ago
The World’s Biggest Oil Producers in 2023
Just three countries accounted for 40% of global oil production last year.
-

 Energy1 month ago
How Much Does the U.S. Depend on Russian Uranium?
Currently, Russia is the largest foreign supplier of nuclear power fuel to the U.S.
-

 Uranium2 months ago
Charted: Global Uranium Reserves, by Country
We visualize the distribution of the world’s uranium reserves by country, with 3 countries accounting for more than half of total reserves.
-

 Energy3 months ago
Visualizing the Rise of the U.S. as Top Crude Oil Producer
Over the last decade, the United States has established itself as the world’s top producer of crude oil, surpassing Saudi Arabia and Russia.

-

 Misc1 week ago
How Hard Is It to Get Into an Ivy League School?
-

 Technology2 weeks ago
Ranked: Semiconductor Companies by Industry Revenue Share
-

 Markets2 weeks ago
Ranked: The World’s Top Flight Routes, by Revenue
-

 Countries2 weeks ago
Population Projections: The World’s 6 Largest Countries in 2075
-

 Markets2 weeks ago
The Top 10 States by Real GDP Growth in 2023
-

 Demographics2 weeks ago
The Smallest Gender Wage Gaps in OECD Countries
-

 United States2 weeks ago
Where U.S. Inflation Hit the Hardest in March 2024
-

 Green2 weeks ago
Top Countries By Forest Growth Since 2001