Energy
Visualizing the EU’s Energy Dependency
![]() Subscribe to the Elements free mailing list for more like this
Subscribe to the Elements free mailing list for more like this
Visualizing the EU’s Energy Dependency
This was originally posted on Elements. Sign up to the free mailing list to get beautiful visualizations on natural resource megatrends in your email every week.
In response to Russia’s 2022 invasion of Ukraine, the U.S. and EU have imposed heavy sanctions aimed at crippling the Russian economy. However, these bold actions also come with some potentially messy complications: Russia is not only one of the world’s largest exporters of energy products, but it is also Europe’s biggest supplier of these fuels.
As of October 2021, Russia supplied 25% of all oil imported by the EU, which is three times more than the second-largest trade partner. Naturally, the policies and circumstances that have led to this dependency have been under major scrutiny in recent weeks.
To help you learn more, this infographic visualizes energy data from Eurostat.
Energy Dependency, by Country
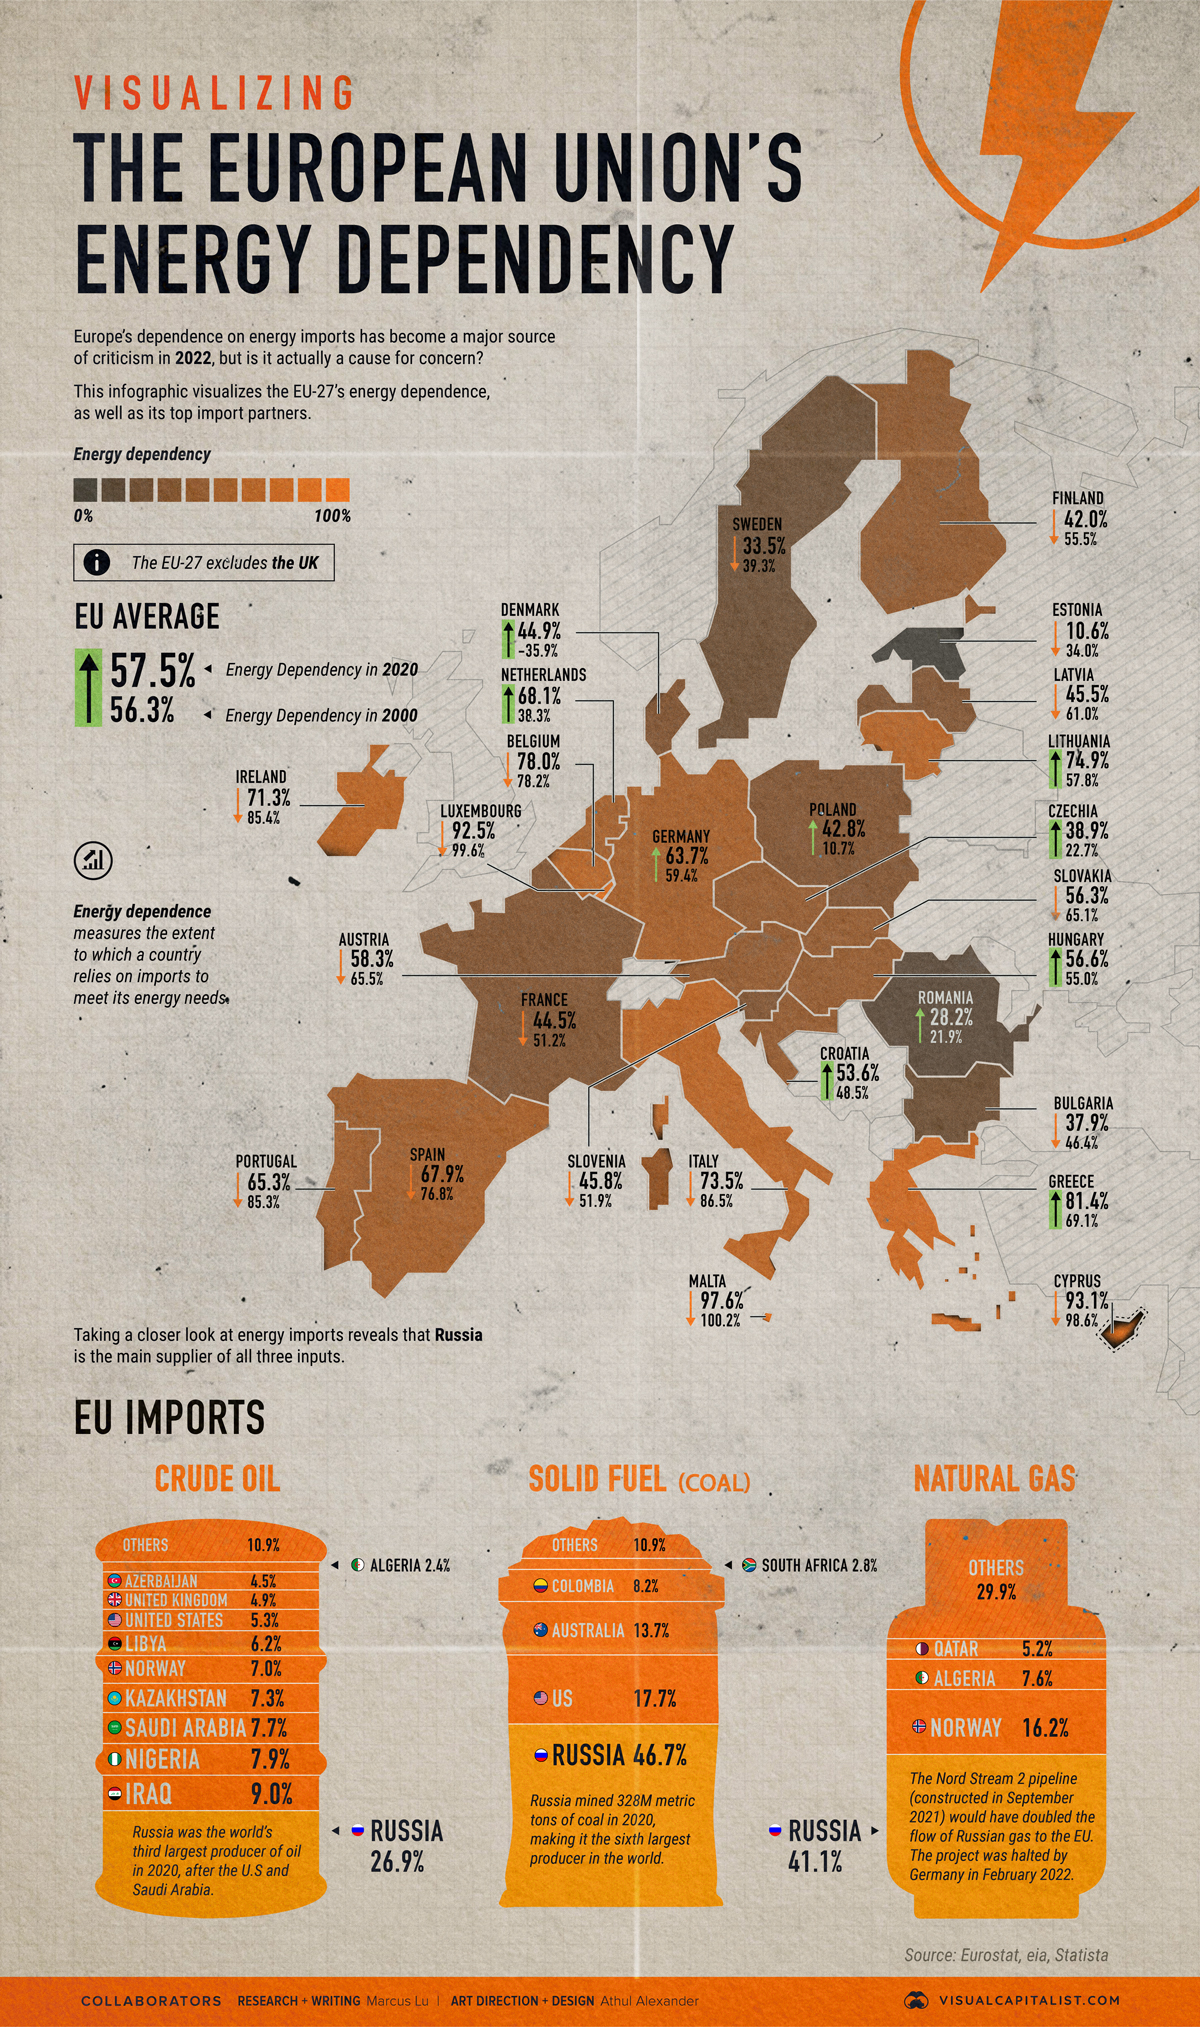
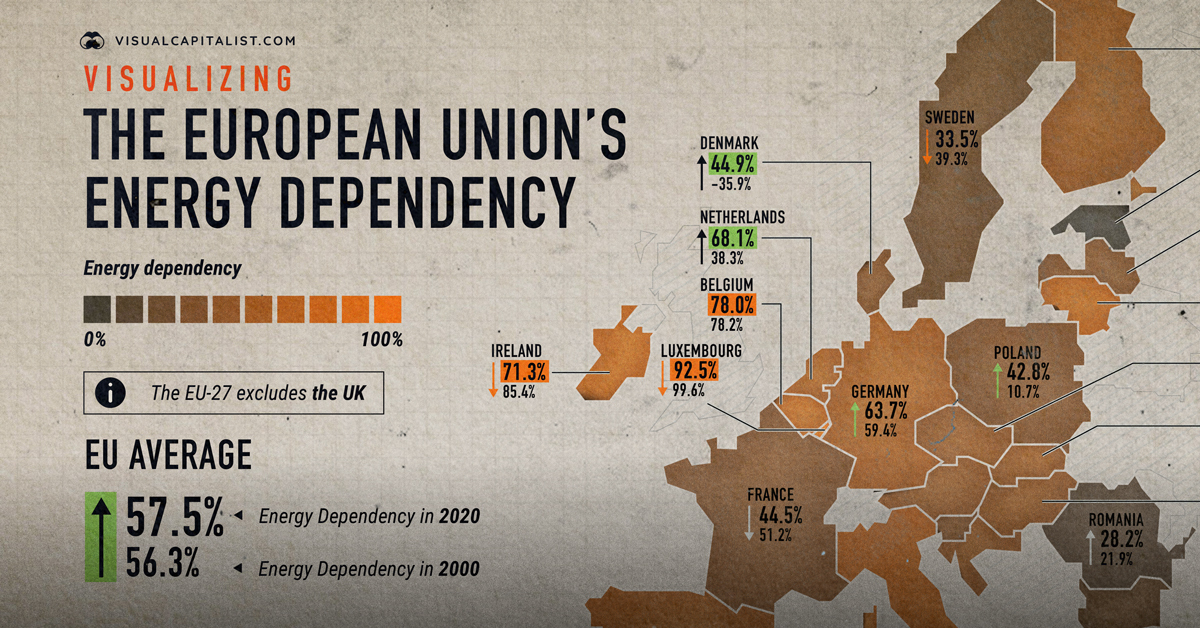
To start, let’s compare the energy dependence of each EU member, both in 2000 and 2020 (the latest year available). This metric shows the extent to which a country relies upon imports to meet its energy needs.
Note that Denmark’s value of -35.9% for the year 2000 is not a typo. Rather, it means that the country was a net exporter of energy.
| Country | 2000 | 2020 |
|---|---|---|
| 🇦🇹 Austria | 65.5% | 58.3% |
| 🇧🇪 Belgium | 78.2% | 78.0% |
| 🇧🇬 Bulgaria | 46.4% | 37.9% |
| 🇭🇷 Croatia | 48.5% | 53.6% |
| 🇨🇾 Cyprus | 98.6% | 93.1% |
| 🇨🇿 Czechia | 22.7% | 38.9% |
| 🇩🇰 Denmark | -35.9% | 44.9% |
| 🇪🇪 Estonia | 34.0% | 10.6% |
| 🇫🇮 Finland | 55.5% | 42.0% |
| 🇫🇷 France | 51.2% | 44.5% |
| 🇩🇪 Germany | 59.4% | 63.7% |
| 🇬🇷 Greece | 69.1% | 81.4% |
| 🇭🇺 Hungary | 55.0% | 56.6% |
| 🇮🇪 Ireland | 85.4% | 71.3% |
| 🇮🇹 Italy | 86.5% | 73.5% |
| 🇱🇻 Latvia | 61.0% | 45.5% |
| 🇱🇹 Lithuania | 57.8% | 74.9% |
| 🇱🇺 Luxembourg | 99.6% | 92.5% |
| 🇲🇹 Malta | 100.2% | 97.6% |
| 🇳🇱 Netherlands | 38.3% | 68.1% |
| 🇵🇱 Poland | 10.7% | 42.8% |
| 🇵🇹 Portugal | 85.3% | 65.3% |
| 🇷🇴 Romania | 21.9% | 28.2% |
| 🇸🇰 Slovakia | 65.1% | 56.3% |
| 🇸🇮 Slovenia | 51.9% | 45.8% |
| 🇪🇸 Spain | 76.8% | 67.9% |
| 🇸🇪 Sweden | 39.3% | 33.5% |
| Average | 56.3% | 57.5% |
Over this 20-year timeframe, the EU-27 average country’s energy dependence has increased from 56.3% to 57.5%, meaning EU members became slightly more reliant on energy imports over those two decades.
Where Do EU’s Energy Imports Come From?
Looking further into energy imports reveals that Russia is the main supplier of crude oil, coal, and natural gas. Continue below for more details.
Crude Oil Imports
The EU imports more crude oil from Russia than the next three countries combined.
| Country | Percentage of total |
|---|---|
| 🇷🇺 Russia | 26.9% |
| 🇮🇶 Iraq | 9.0% |
| 🇳🇬 Nigeria | 7.9% |
| 🇸🇦 Saudi Arabia | 7.7% |
| 🇰🇿 Kazakhstan | 7.3% |
| 🇳🇴 Norway | 7.0% |
| 🇱🇾 Libya | 6.2% |
| 🇺🇸 United States | 5.3% |
| 🇬🇧 United Kingdom | 4.9% |
| 🇦🇿 Azerbaijan | 4.5% |
| 🇩🇿 Algeria | 2.4% |
| Others | 10.9% |
This shouldn’t come as a surprise, as Russia was the world’s third largest producer of oil in 2020. The country has several state-owned oil companies including Rosneft and Gazprom.
Coal Imports
Coal-fired power plants are still being used across the EU, though most member states expect to completely phase them out by 2030.
| Country | Percentage of total |
|---|---|
| 🇷🇺 Russia | 46.7% |
| 🇺🇸 United States | 17.7% |
| 🇦🇺 Australia | 13.7% |
| 🇨🇴 Colombia | 8.2% |
| 🇿🇦 South Africa | 2.8% |
| Others | 10.9% |
Russia has the second largest coal reserves in the world. In 2020, it mined 328 million metric tons, making it the sixth largest producer globally.
Natural Gas Imports
Natural gas is commonly used to heat buildings and water. A majority of the EU’s supply comes from Russia via the Nord Stream series of pipelines.
| Country | Percentage of total |
|---|---|
| 🇷🇺 Russia | 41.1% |
| 🇳🇴 Norway | 16.2% |
| 🇩🇿 Algeria | 7.6% |
| 🇶🇦 Qatar | 5.2% |
| Others | 29.9% |
Nord Stream 1 is the longest sub-sea pipeline in the world and was completed in 2011. It starts from the Russian city of Vyborg and connects to the EU through Germany.
Nord Stream 2 is a recently constructed expansion which was expected to double the project’s capacity. Germany has since halted the approval process for this pipeline in response to Russia’s 2022 invasion of Ukraine.
What Happens Now?
In retaliation against Western sanctions, Russia has announced an impending ban on exports of certain goods and raw materials.
European gas prices skyrocketed in response, as many fear that Russia could cut off natural gas supplies. This, of course, would have very negative effects on both consumers and businesses.
In early March 2022, both the European Commission and the International Energy Agency (IEA) introduced proposals on how Europe could reduce its energy dependency.
We must become independent from Russian oil, coal and gas. We simply cannot rely on a supplier who explicitly threatens us.
– Ursula von der Leyen, President of the European Commission
Cutting off one’s biggest supplier is likely to cause issues, especially when dealing with something as critical as energy. Few countries have the capacity (or willingness) to immediately replace Russian imports.
The proposals also discussed options for boosting Europe’s domestic output, though the commission’s report notably excluded nuclear power. For various reasons, nuclear remains a polarizing topic in Europe, with countries taking either a pro or anti stance.


Energy
Charted: 4 Reasons Why Lithium Could Be the Next Gold Rush
Visual Capitalist has partnered with EnergyX to show why drops in prices and growing demand may make now the right time to invest in lithium.


4 Reasons Why You Should Invest in Lithium
Lithium’s importance in powering EVs makes it a linchpin of the clean energy transition and one of the world’s most precious minerals.
In this graphic, Visual Capitalist partnered with EnergyX to explore why now may be the time to invest in lithium.
1. Lithium Prices Have Dropped
One of the most critical aspects of evaluating an investment is ensuring that the asset’s value is higher than its price would indicate. Lithium is integral to powering EVs, and, prices have fallen fast over the last year:
| Date | LiOH·H₂O* | Li₂CO₃** |
|---|---|---|
| Feb 2023 | $76 | $71 |
| March 2023 | $71 | $61 |
| Apr 2023 | $43 | $33 |
| May 2023 | $43 | $33 |
| June 2023 | $47 | $45 |
| July 2023 | $44 | $40 |
| Aug 2023 | $35 | $35 |
| Sept 2023 | $28 | $27 |
| Oct 2023 | $24 | $23 |
| Nov 2023 | $21 | $21 |
| Dec 2023 | $17 | $16 |
| Jan 2024 | $14 | $15 |
| Feb 2024 | $13 | $14 |
Note: Monthly spot prices were taken as close to the 14th of each month as possible.
*Lithium hydroxide monohydrate MB-LI-0033
**Lithium carbonate MB-LI-0029
2. Lithium-Ion Battery Prices Are Also Falling
The drop in lithium prices is just one reason to invest in the metal. Increasing economies of scale, coupled with low commodity prices, have caused the cost of lithium-ion batteries to drop significantly as well.
In fact, BNEF reports that between 2013 and 2023, the price of a Li-ion battery dropped by 82%.
| Year | Price per KWh |
|---|---|
| 2023 | $139 |
| 2022 | $161 |
| 2021 | $150 |
| 2020 | $160 |
| 2019 | $183 |
| 2018 | $211 |
| 2017 | $258 |
| 2016 | $345 |
| 2015 | $448 |
| 2014 | $692 |
| 2013 | $780 |

3. EV Adoption is Sustainable
One of the best reasons to invest in lithium is that EVs, one of the main drivers behind the demand for lithium, have reached a price point similar to that of traditional vehicle.
According to the Kelly Blue Book, Tesla’s average transaction price dropped by 25% between 2022 and 2023, bringing it in line with many other major manufacturers and showing that EVs are a realistic transport option from a consumer price perspective.
| Manufacturer | September 2022 | September 2023 |
|---|---|---|
| BMW | $69,000 | $72,000 |
| Ford | $54,000 | $56,000 |
| Volkswagon | $54,000 | $56,000 |
| General Motors | $52,000 | $53,000 |
| Tesla | $68,000 | $51,000 |
4. Electricity Demand in Transport is Growing
As EVs become an accessible transport option, there’s an investment opportunity in lithium. But possibly the best reason to invest in lithium is that the IEA reports global demand for the electricity in transport could grow dramatically by 2030:
| Transport Type | 2022 | 2025 | 2030 |
|---|---|---|---|
| Buses 🚌 | 23,000 GWh | 50,000 GWh | 130,000 GWh |
| Cars 🚙 | 65,000 GWh | 200,000 GWh | 570,000 GWh |
| Trucks 🛻 | 4,000 GWh | 15,000 GWh | 94,000 GWh |
| Vans 🚐 | 6,000 GWh | 16,000 GWh | 72,000 GWh |
The Lithium Investment Opportunity
Lithium presents a potentially classic investment opportunity. Lithium and battery prices have dropped significantly, and recently, EVs have reached a price point similar to other vehicles. By 2030, the demand for clean energy, especially in transport, will grow dramatically.
With prices dropping and demand skyrocketing, now is the time to invest in lithium.
EnergyX is poised to exploit lithium demand with cutting-edge lithium extraction technology capable of extracting 300% more lithium than current processes.

-

 Lithium2 days ago
Ranked: The Top 10 EV Battery Manufacturers in 2023
Asia dominates this ranking of the world’s largest EV battery manufacturers in 2023.
-

 Energy1 week ago
The World’s Biggest Nuclear Energy Producers
China has grown its nuclear capacity over the last decade, now ranking second on the list of top nuclear energy producers.
-

 Energy4 weeks ago
The World’s Biggest Oil Producers in 2023
Just three countries accounted for 40% of global oil production last year.
-

 Energy1 month ago
How Much Does the U.S. Depend on Russian Uranium?
Currently, Russia is the largest foreign supplier of nuclear power fuel to the U.S.
-

 Uranium2 months ago
Charted: Global Uranium Reserves, by Country
We visualize the distribution of the world’s uranium reserves by country, with 3 countries accounting for more than half of total reserves.
-

 Energy3 months ago
Visualizing the Rise of the U.S. as Top Crude Oil Producer
Over the last decade, the United States has established itself as the world’s top producer of crude oil, surpassing Saudi Arabia and Russia.


-

 Markets1 week ago
U.S. Debt Interest Payments Reach $1 Trillion
-

 Markets2 weeks ago
Ranked: The Most Valuable Housing Markets in America
-

 Money2 weeks ago
Which States Have the Highest Minimum Wage in America?
-

 AI2 weeks ago
Ranked: Semiconductor Companies by Industry Revenue Share
-

 Markets2 weeks ago
Ranked: The World’s Top Flight Routes, by Revenue
-

 Countries2 weeks ago
Population Projections: The World’s 6 Largest Countries in 2075
-

 Markets2 weeks ago
The Top 10 States by Real GDP Growth in 2023
-

 Money2 weeks ago
The Smallest Gender Wage Gaps in OECD Countries