Culture
Where Do Your Christmas Decorations Come From?


The World’s Biggest Exporters of Christmas Decorations
Billions of dollars worth of Christmas decorations are exported around the world each year.
And while they adorn many homes across the globe, you may be surprised to know that a majority of these decorations are manufactured in just a handful of countries.
Using data from the UN Comtrade Database, this festive visualization highlights the world’s top exporters of Christmas decor.
Ranked: Top 10 Exporters of Christmas Decorations
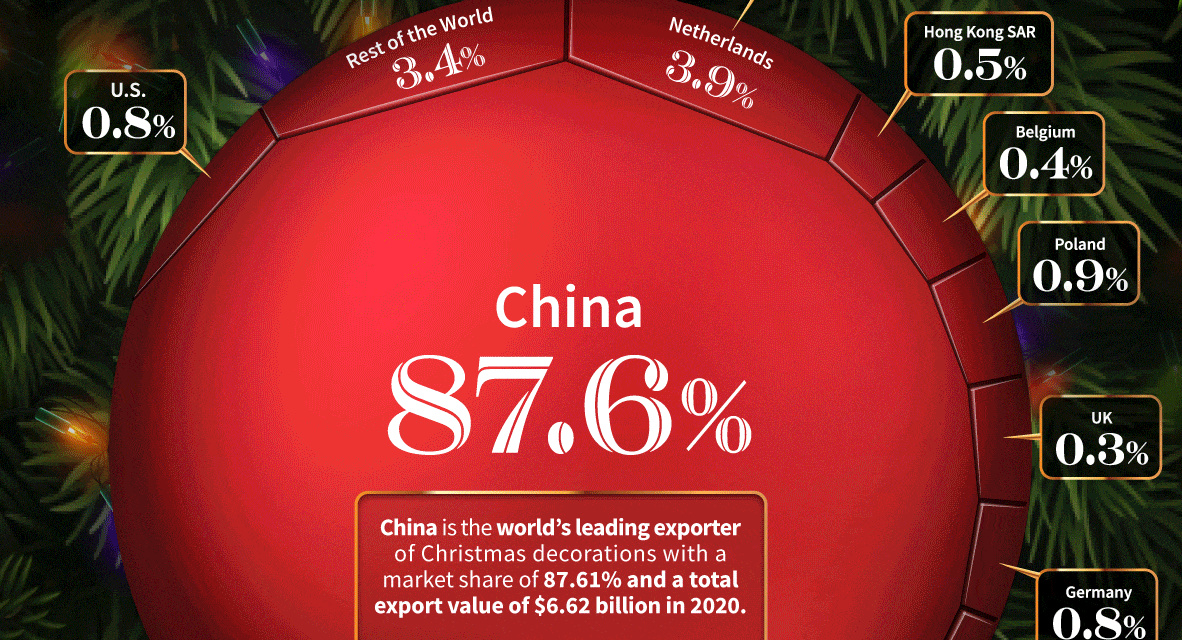
China accounts for 87% of global Christmas decoration exports (excluding candles, electric lighting sets, and natural Christmas trees), with a total export value of $6.62 billion in 2020.
Here are the top 10 countries by export volume:
| Rank | Country | Market Share Year 2020 | Export value Year 2020 |
|---|---|---|---|
| 1 | 🇨🇳 China | 87.61% | $6,623,948,022 |
| 2 | 🇳🇱 Netherlands | 3.95% | $298,587,959 |
| 3 | 🇵🇱 Poland | 0.91% | $68,670,015 |
| 4 | 🇮🇳 India | 0.84% | $63,605,927 |
| 5 | 🇩🇪 Germany | 0.83% | $63,035,762 |
| 6 | 🇺🇸 United States | 0.77% | $58,045,102 |
| 7 | 🇭🇰 Hong Kong | 0.51% | $38,344,945 |
| 8 | 🇧🇪 Belgium | 0.43% | $32,787,984 |
| 9 | 🇹🇭 Thailand | 0.43% | $32,365,786 |
| 10 | 🇬🇧 United Kingdom | 0.33% | $24,580,583 |
China’s market share dwarfs its competitors. Netherlands comes a distant second, capturing only 3.95% of the market, while Poland is third with just 0.91%.
Another interesting fact we can extract from the data is that the top 10 countries own a 96.91% share of the Christmas decoration export market, which leaves just 3.09% of the market to the other 185 countries around the globe.
The Other Side of the Coin: Imports
We’ve covered who the biggest exporters of Christmas decorations are, but this begs the question—which countries are importing all of this festive fare?
Here are the top five countries by import volume:
| Rank | Country | Market Share Year 2019 | Market Share Year 2020 | Import value Year 2020 |
|---|---|---|---|---|
| 1 | 🇺🇸 United States | 58.17% | 57.34% | $3,054,607,847 |
| 2 | 🇬🇧 United Kingdom | 5.18% | 5.07% | $270,152,835 |
| 3 | 🇨🇦 Canada | 4.54% | 5.00% | $266,304,196 |
| 4 | 🇩🇪 Germany | 2.69% | 2.99% | $159,401,785 |
| 5 | 🇳🇱 Netherlands | 2.55% | 2.93% | $156,000,611 |
The United States is by far the biggest importer of Christmas decorations, importing 57.34% of the total market share of Christmas decorations with a total value of $3 billion.
The top five importers have a market share of 73.33% with a total value of $3.9 billion.
Why Are Christmas Decorations More Expensive This Year?
Yiwu, a Chinese city situated 175 miles southwest of Shanghai, is the world’s biggest hub for manufacturing Christmas decorations, accounting for nearly 80% of the Christmas products exported from China.
Factories in Yiwu are suffering a shortage of raw materials which is causing an increase in production costs.
On top of that, since mid-October, Yiwu, like many other cities, has been affected by China’s ongoing electricity shortage, which has forced manufacturers to install power generators or even stop their manufacturing activities altogether.
As if that wasn’t enough, shipping from China has become a lot more expensive in 2021. Over the past year, it’s become 4x more expensive to ship a standard container from China to Europe.


Culture
Ranked: America’s Most Popular Beers, by Generation
We visualize the results of a YouGov survey that determined the most popular beers among each U.S. generation.
America’s Most Popular Beers, by Generation
This was originally posted on our Voronoi app. Download the app for free on iOS or Android and discover incredible data-driven charts from a variety of trusted sources.
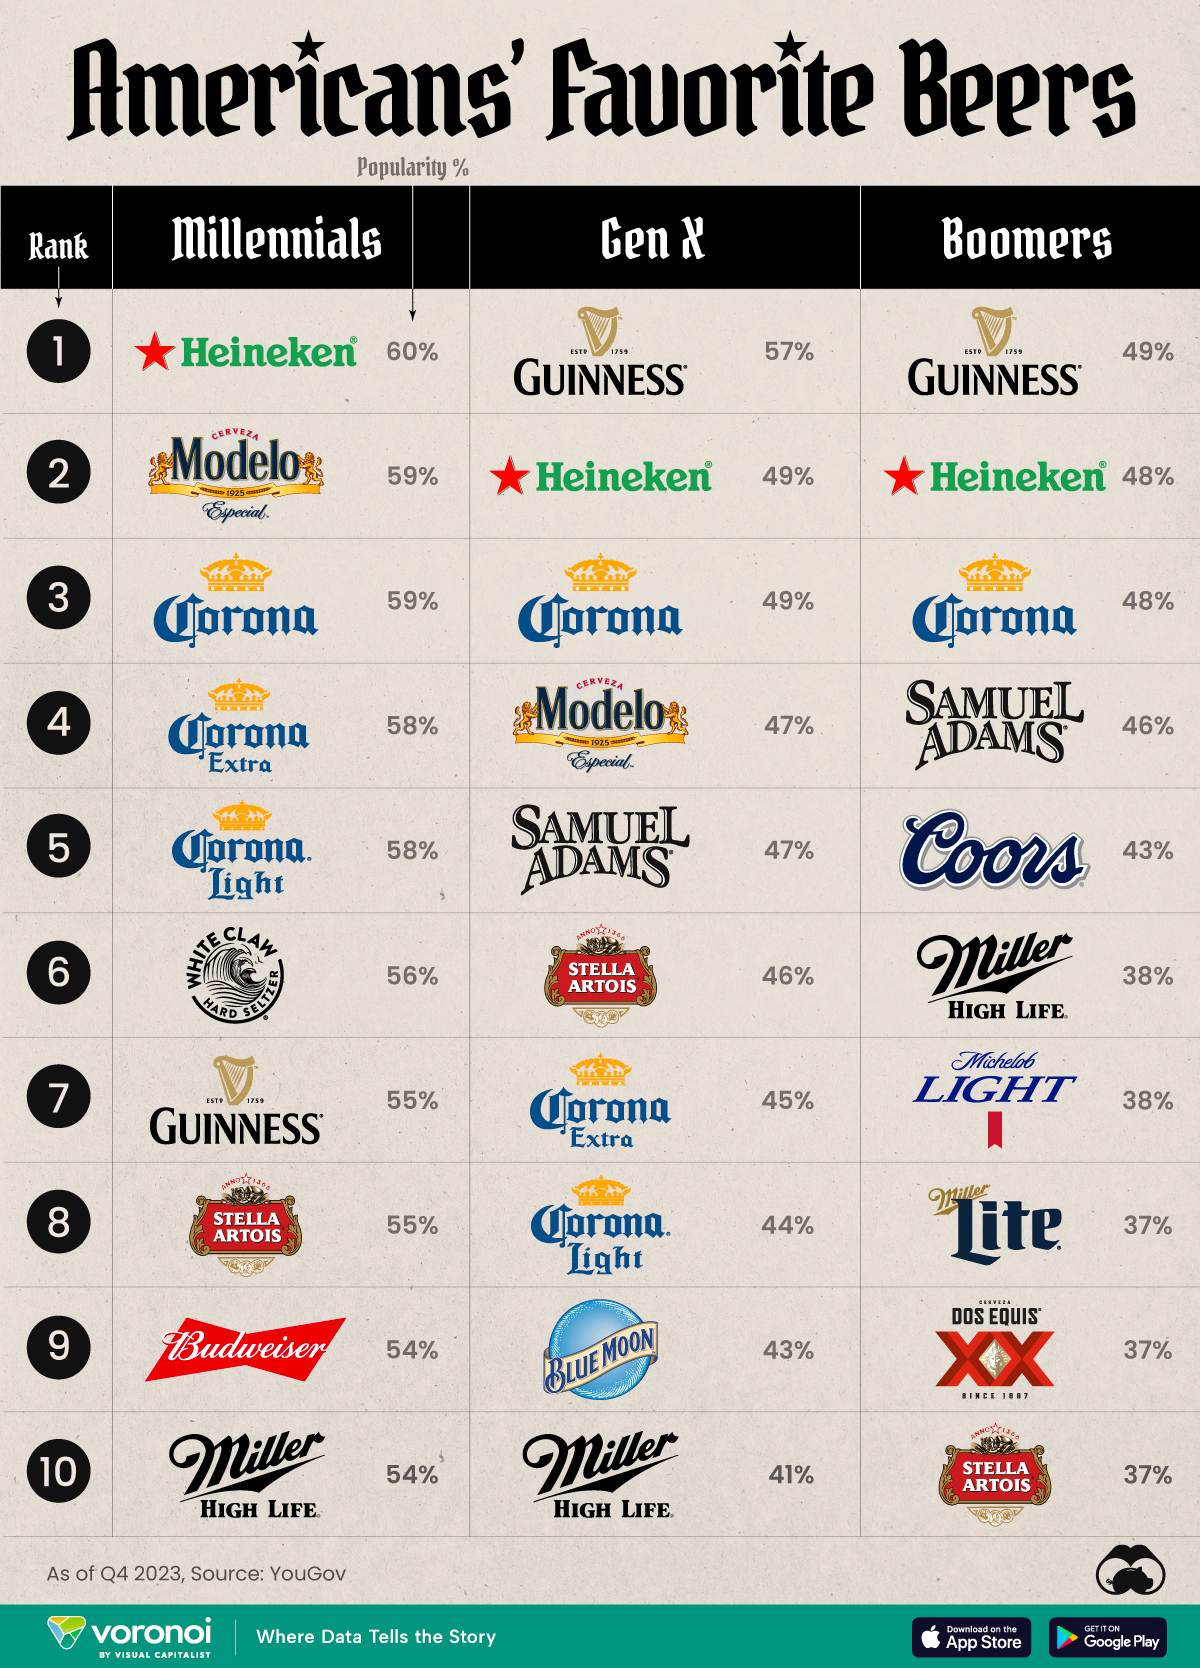
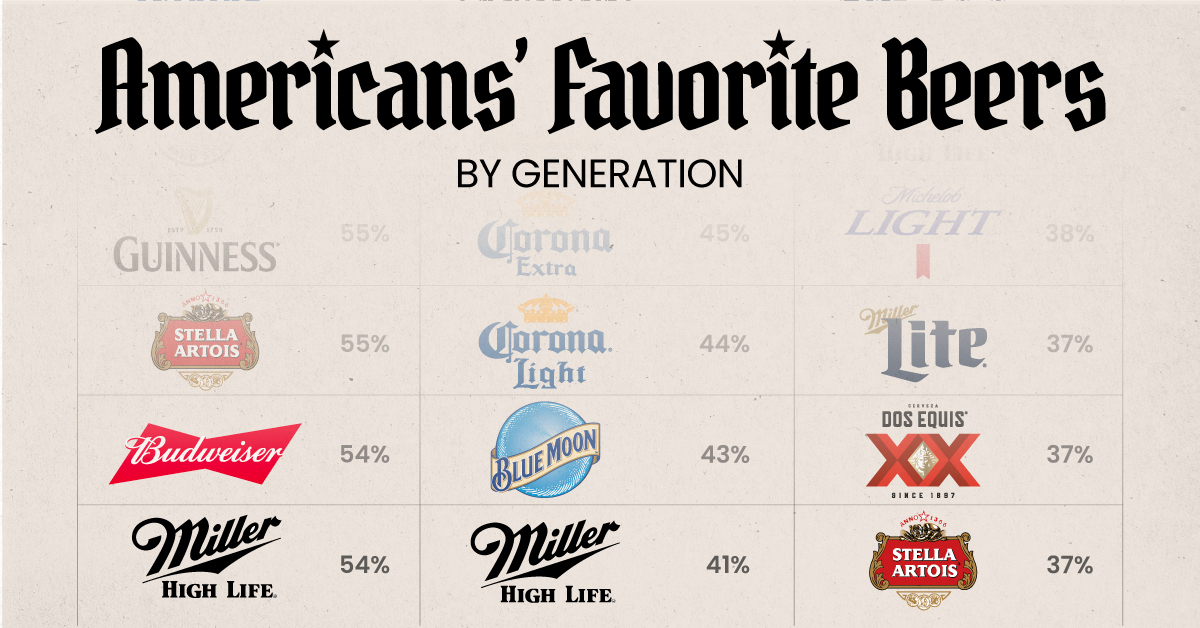
In this graphic we’ve visualized the most popular beers for each U.S. generation as of Q4 2023, according to a consumer survey conducted by YouGov.
The “popularity” metric represents the % of people who had a positive opinion of that beer. Note that YouGov surveys are conducted with a representative sample of 1,500 respondents.
Overview: Millennials
U.S. millennials appear to favor foreign beers, with the top five spots taken by Dutch (Heineken) or Mexican beers (Modelo, Corona).
| Beer | Popularity (%) |
|---|---|
| 🇳🇱 Heineken | 60 |
| 🇲🇽 Modelo | 59 |
| 🇲🇽 Corona | 59 |
| 🇲🇽 Corona Extra | 58 |
| 🇲🇽 Corona Light | 58 |
| 🇺🇸 White Claw | 56 |
| 🇮🇪 Guinness | 55 |
| 🇧🇪 Stella Artois | 55 |
| 🇺🇸 Budweiser | 54 |
| 🇺🇸 Miller | 54 |
While not exactly a beer, White Claws (which have a similar alcohol content) claimed sixth place. Hard seltzers have become very popular in recent years due to their variety of flavors, attractive packaging, and relatively low amount of carbs and calories.
Overview: Gen X
Gen X also has a strong preference for foreign beers, particularly Guinness (fun fact: Over 31 million Americans claim to be of Irish descent).
| Beer | Popularity (%) |
|---|---|
| 🇮🇪 Guinness | 57 |
| 🇳🇱 Heineken | 49 |
| 🇲🇽 Corona | 49 |
| 🇲🇽 Modelo | 47 |
| 🇺🇸 Samuel Adams | 47 |
| 🇧🇪 Stella Artois | 46 |
| 🇲🇽 Corona Extra | 45 |
| 🇲🇽 Corona Light | 44 |
| 🇺🇸 Blue Moon | 43 |
| 🇺🇸 Miller | 41 |
Two American beers that weren’t on Millennials’ top 10 list are Samuel Adams and Blue Moon.
Samuel Adams is the flagship brand of the Boston Beer Company, named after U.S. Founding Father Samuel Adams. On the other hand, Blue Moon is a Belgian-style witbier brewed by Molson Coors.
Overview: Baby Boomers
Boomers’ top 10 favorite beers are similar to Gen X, with a few key differences. One is the absence of Modelo, which ranked second and fourth for Millennials and Gen X, respectively.
Modelo (which became America’s best-selling beer in 2023) has focused its advertising efforts on sports, which may not reach Boomers as effectively as younger generations.
| Beer | Popularity (%) |
|---|---|
| 🇮🇪 Guinness | 49 |
| 🇳🇱 Heineken | 48 |
| 🇲🇽 Corona | 48 |
| 🇺🇸 Samuel Adams | 46 |
| 🇺🇸 Coors | 43 |
| 🇺🇸 Miller | 38 |
| 🇺🇸 Michelob Light | 38 |
| 🇺🇸 Miller Lite | 37 |
| 🇲🇽 Dos Equis | 37 |
| 🇧🇪 Stella Artois | 37 |
An interesting pick for Boomers is Dos Equis, which is produced by Heineken-owned Cuauhtémoc Moctezuma Brewery. The brand gained popularity for its “most interesting man in the world” commercials, which ran from 2006 to 2018.
See More Beer Graphics 🍺
Be sure to check out this graphic which breaks down global beer consumption by country.

-

 Maps2 weeks ago
Mapped: Average Wages Across Europe
-

 Money1 week ago
Which States Have the Highest Minimum Wage in America?
-

 Real Estate1 week ago
Ranked: The Most Valuable Housing Markets in America
-

 Markets1 week ago
Charted: Big Four Market Share by S&P 500 Audits
-

 AI1 week ago
The Stock Performance of U.S. Chipmakers So Far in 2024
-

 Automotive2 weeks ago
Almost Every EV Stock is Down After Q1 2024
-

 Money2 weeks ago
Where Does One U.S. Tax Dollar Go?
-

 Green2 weeks ago
Ranked: Top Countries by Total Forest Loss Since 2001