Healthcare
How Millennial Doctors Are Transforming Medicine


How Millennial Doctors Are Transforming Medicine
Changing healthcare models, groundbreaking advancements in the health technology sector, and shifting standards of patient care—they’re all contributing to a new era of medicine. But arguably one of the biggest changes will be the faces that greet us at a clinic or hospital.
Today’s infographic from Publicis Health illustrates the emerging generation of millennial doctors, and why they’re on the cusp of transforming the healthcare industry.
The Changing Face of Medicine
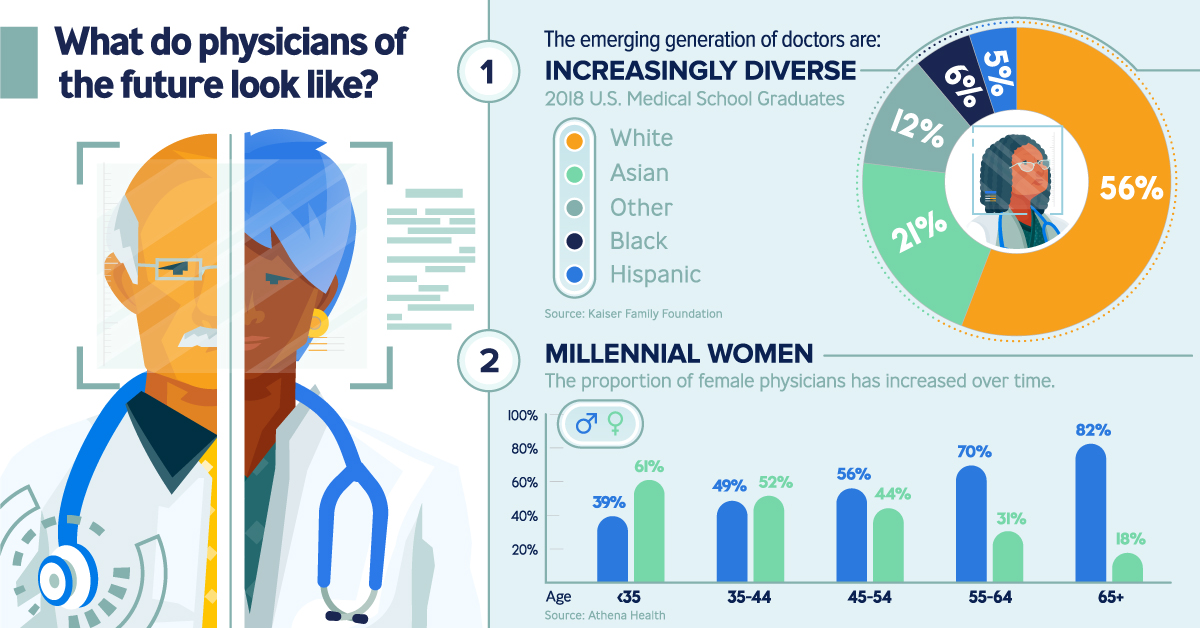
The doctor is in, but it’s probably not who you’re thinking of. Most people expect to see an older white male as their healthcare provider, yet today’s physicians are straying from this stereotype:
- Increasingly diverse
44% of U.S. medical school graduates in 2018 were of a racial minority background. - Millennial women
61% of physicians under the age of 35 are females. - Digital-focused
They’re adept at practicing medicine with digital tools, like electronic health records and telemedicine.
These younger doctors face intense financial pressure from student loans as they enter the workforce—an average of $190,000 to be precise—and it’s part of the reason that they’re more likely than their Gen X and Boomer counterparts to take jobs in hospital networks.
Shifting practices are also altering interactions between these new doctors and their patients. As patients increasingly behave like consumers, they have to keep pace with their demands for shared decision-making and higher personalization.
- Millennial doctors spend over 8 hours a day on screens: 5 hours using
electronic health records, and 3 hours more consulting external search websites. - 37% of them also rely on social networks and message boards for work, compared to 25% of their peers aged 55 and above.
The silver lining? These new doctors are digital natives first, which means they’re comfortable using tools to help them practice medicine more efficiently than their predecessors.
Bridging the Gap for Millennial Doctors
The new profile of healthcare providers are seeing the lines between their work settings and everyday lives being increasingly blurred. When they don their “white coat” persona, millennial doctors are aware that they’re always under the microscope.
- 77% of patients rely on online reviews before choosing a physician
- 80% of consumers trust online reviews alongside personal recommendations
- 60% of consumers read four or more reviews before deciding on a doctor
As consumers themselves, millennial physicians are also constantly bombarded with content. They’re active on social media during their “blue jeans” moments, allowing them to engage with patients even in their downtime. This entirely new environment propels their healthcare decision-making in radical ways.
Credible channels, actionable data dashboards, personalized communication, and patient-centric tools all contribute towards the industry’s attempts to bridge this gap for millennial doctors and their patients—to reach them at the right place, at the right time.


Healthcare
The Cost of an EpiPen in Major Markets
This visualization compares EpiPen prices around the world, with the U.S. having the highest prices by far.


The Cost of an EpiPen in Major Markets
This was originally posted on our Voronoi app. Download the app for free on iOS or Android and discover incredible data-driven charts from a variety of trusted sources.
EpiPens are auto-injectors containing epinephrine, a drug that can treat or reverse severe allergic reactions, potentially preventing death.
The global epinephrine market was valued at $1.75 billion in 2022 and is projected to reach $4.08 billion by 2030. North America represents over 60% of the market.
EpiPens, however, can be prohibitively expensive in some regions.
In this graphic, we present estimated EpiPen prices in major global markets, compiled by World Population Review and converted to U.S. dollars as of August 2023.
Why are U.S. Prices so High?
The U.S. stands out as the most expensive market for EpiPens, despite over 1 million Americans having epinephrine prescriptions. After Mylan (now part of Pfizer) acquired the rights to produce EpiPens in the U.S. in 2007, the cost of a two-pack skyrocketed to $600, up from about $60.
| Country | Price (USD) |
|---|---|
| 🇺🇸 U.S. | 300* |
| 🇯🇵 Japan | 98 |
| 🇩🇪 Germany | 85 |
| 🇨🇦 Canada | 80 |
| 🇫🇷 France | 76 |
| 🇦🇺 Australia | 66 |
| 🇬🇧 UK | 61 |
| 🇮🇳 India | 30 |
*Per unit cost. Commonly sold as a two-pack, meaning total cost is equal to $600
Former Mylan CEO Heather Bresch defended the price hikes to Congress, citing minimal profit margins. Mylan eventually settled with the U.S. government for a nine-figure sum.
Notably, EpiPens are available at a fraction of the cost in other developed countries like Japan, Germany, and Canada.
Making EpiPens More Affordable
Efforts to improve EpiPen affordability are underway in several U.S. states. For instance, the Colorado House approved a $60 price cap on epinephrine, now under review by the state Senate.
Similar measures in Rhode Island, Delaware, Missouri, and Vermont aim to ensure insurance coverage for epinephrine, which is not currently mandatory, although most health plans cover it.

-

 Science1 week ago
Visualizing the Average Lifespans of Mammals
-

 Markets2 weeks ago
The Top 10 States by Real GDP Growth in 2023
-

 Demographics2 weeks ago
The Smallest Gender Wage Gaps in OECD Countries
-

 United States2 weeks ago
Where U.S. Inflation Hit the Hardest in March 2024
-

 Green2 weeks ago
Top Countries By Forest Growth Since 2001
-

 United States2 weeks ago
Ranked: The Largest U.S. Corporations by Number of Employees
-

 Maps2 weeks ago
The Largest Earthquakes in the New York Area (1970-2024)
-

 Green2 weeks ago
Ranked: The Countries With the Most Air Pollution in 2023