Connect with us

Healthcare

How Artificial Intelligence is Transforming Clinical Trial Recruitment

Published

on

Navigating Transformative Forces in HealthcareHow Big Data Will Unlock the Potential of HealthcareHow Tech is Changing How Healthcare Must Communicate With PatientsThe Amazonification of HealthcareHow Artificial Intelligence is Transforming Clinical Trial RecruitmentEHR as a GPS for HealthcareMillennial Doctors Transforming Medicine

How Artificial Intelligence is Transforming Clinical Trial Recruitment

How AI is Transforming Clinical Trial Recruitment

The medical world is shifting underneath our feet.

To keep up with the rising demands of empowered patients, physicians and pharma businesses regularly test innovative treatments and medicines during rigorous clinical trials.

But one misguided move can trigger a domino effect, such as when the wrong patients are selected for a clinical trial.

Today’s infographic comes to us from Publicis Health, and it highlights why the current model of clinical trial recruitment urgently needs to change.

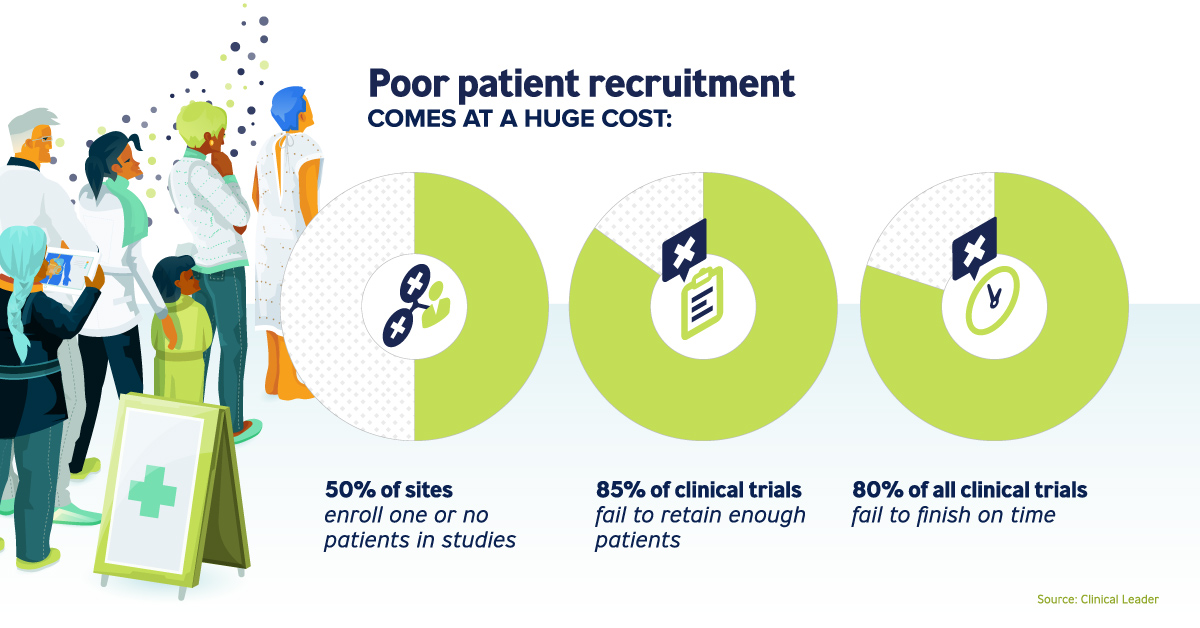
The Cost of Clinical Trials

Clinical trials help to determine if a new treatment, drug, or device is safe for the larger patient population.

Patients are at the heart of these clinical trials, and poor patient recruitment has dire consequences:

  • 50% of sites enroll one or no patients in studies
  • 85% of clinical trials fail to retain enough patients
  • 80% of all clinical trials fail to finish on time

A single trial can cost anywhere from $44 million to $115 million. But hereโ€™s the kicker โ€“ according to a CenterWatch survey, delays can cost a trial between $600,000 and $8 million per day.

For these reasons, it’s crucial for pharma trial sponsors to find the right fit for clinical trials from the start.

A 360ยฐ View

The healthcare industry is moving towards a people-based marketing approach, to discover and engage the right patient one-on-one.

Advanced technology and connected patient data work in tandem with millions of real-time consumer behaviors, creating a rich and accurate profile of the perfect patient match.

The use of artificial intelligence, machine learning, and predictive analytics unearth further insights, weighting those patients with the behavioral tendencies most suited for the trial:

Omni-channel targeting
Actively reaching out to patients, wherever they are.

Predictive analytics
Continually refining media channels and messaging to further patient interest.

Ongoing communications
Nurturing relationships with patients, starting with the initial outreach.

Transforming Value

Applying a people-based approach to patient recruitment has a myriad of benefits, many of which live on long after the original trial’s completion.

AdvantageValue added
Recruitment- Accurate insight generation
- Real time optimization
- Faster and improved quality
- More efficient
- Increased conversion
- Reduced costs
Engagement- Behavioral-based messaging
- Personalized trial participation experiences
- Precise engagement at scale
- Drives patient adherence and retention during a trial
Long-term benefits of data collected- Develops patient profiles for future trials
- Guides the planning of the patient demographic
- Informs drug launch activities
- Accelerates recruitment and reduces start-up costs
- Speeds up commercialization of new drugs
- Supports disease awareness and educational campaigns

As clinical trials are successfully completed on time โ€“ allowing new drugs to reach the market faster than before โ€“ patients will benefit from easier access to groundbreaking treatments.

This is part five of a seven part series. Stay tuned by subscribing to Visual Capitalist for free, as we wrap up with the final two transformative forces shaping the future of healthcare.

Navigating Transformative Forces in HealthcareHow Big Data Will Unlock the Potential of HealthcareHow Tech is Changing How Healthcare Must Communicate With PatientsThe Amazonification of HealthcareHow Artificial Intelligence is Transforming Clinical Trial RecruitmentEHR as a GPS for HealthcareMillennial Doctors Transforming Medicine
Subscribe to Visual Capitalist
Click for Comments

Countries

Charted: The Worldโ€™s Aging Population from 1950 to 2100

This graphic visualizes the worldโ€™s aging population, showing data for every country and territory around the world.

Published

on

Charted: The Worldโ€™s Aging Population from 1950 to 2100

As demographics continue to shift in the 21st century, the worldโ€™s aging population will continue to be a focal point for many global decision makers.

Most countries around the world have experienced population explosions, or are about to. Combine this with declining birth rates and falling mortality rates, and it’s clear that the global senior population will continue to reach new heights.

These graphics by Pablo Alvarez use data from the 2022 UN World Population Prospects to visualize this increasing aging population across countries.

The Worldโ€™s Aging Population from 1950 to 2100

In 2022, there were 771 million people aged 65+ years globally, accounting for almost 10% of the world’s population.

This segment has been growing at an increasing rate, and it’s expected to hit 16% in 2050, and eventually 24% by 2100. Here’s what that’s projected to look like, for every country and territory.

Country by Population Aged +65 Years195020222100
๐Ÿ‡ฆ๐Ÿ‡ซ Afghanistan2.85%2.39%16.03%
๐Ÿ‡ฆ๐Ÿ‡ฑ Albania6.04%16.66%49.08%
๐Ÿ‡ฉ๐Ÿ‡ฟ Algeria3.49%6.39%28.83%
๐Ÿ‡ฆ๐Ÿ‡ธ American Samoa2.38%7.27%45.41%
๐Ÿ‡ฆ๐Ÿ‡ฉ Andorra10.02%14.98%37.04%
๐Ÿ‡ฆ๐Ÿ‡ด Angola2.93%2.6%12.07%
๐Ÿ‡ฆ๐Ÿ‡ฎ Anguilla3.69%10.71%37.49%
๐Ÿ‡ฆ๐Ÿ‡ฌ Antigua and Barbuda4.14%10.63%35.4%
๐Ÿ‡ฆ๐Ÿ‡ท Argentina4.13%11.92%31.79%
๐Ÿ‡ฆ๐Ÿ‡ฒ Armenia8.17%13.15%36.13%
๐Ÿ‡ฆ๐Ÿ‡ผ Aruba1.77%16.15%36.51%
๐Ÿ‡ฆ๐Ÿ‡บ Australia8.17%16.9%31.38%
๐Ÿ‡ฆ๐Ÿ‡น Austria10.42%19.81%33.93%
๐Ÿ‡ฆ๐Ÿ‡ฟ Azerbaijan6.89%7.11%30.5%
๐Ÿ‡ง๐Ÿ‡ธ Bahamas4.76%8.89%29.58%
๐Ÿ‡ง๐Ÿ‡ญ Bahrain2.88%3.76%21.89%
๐Ÿ‡ง๐Ÿ‡ฉ Bangladesh3.9%6.04%32.56%
๐Ÿ‡ง๐Ÿ‡ง Barbados5.24%16.28%33.19%
๐Ÿ‡ง๐Ÿ‡พ Belarus8.24%17.18%30.45%
๐Ÿ‡ง๐Ÿ‡ช Belgium11.03%19.73%32.83%
๐Ÿ‡ง๐Ÿ‡ฟ Belize3.57%5.09%29.21%
๐Ÿ‡ง๐Ÿ‡ฏ Benin7.85%3.06%11.03%
๐Ÿ‡ง๐Ÿ‡ฒ Bermuda5.71%20.41%37.73%
๐Ÿ‡ง๐Ÿ‡น Bhutan2.53%6.25%33.35%
๐Ÿ‡ง๐Ÿ‡ด Bolivia6.11%4.85%21.75%
๐Ÿ‡ง๐Ÿ‡ถ Bonaire Sint Eustatius and Saba14.22%13.84%28.94%
๐Ÿ‡ง๐Ÿ‡ฆ Bosnia and Herzegovina3.95%18.4%36.4%
๐Ÿ‡ง๐Ÿ‡ผ Botswana4.32%3.65%17.96%
๐Ÿ‡ง๐Ÿ‡ท Brazil2.39%9.88%33.52%
๐Ÿ‡ป๐Ÿ‡ฌ British Virgin Islands8.63%9.95%32.47%
๐Ÿ‡ง๐Ÿ‡ณ Brunei4.85%6.17%30.93%
๐Ÿ‡ง๐Ÿ‡ฌ Bulgaria6.66%22.38%37.13%
๐Ÿ‡ง๐Ÿ‡ซ Burkina Faso2.01%2.53%13.07%
๐Ÿ‡ง๐Ÿ‡ฎ Burundi3.22%2.48%13.23%
๐Ÿ‡ฐ๐Ÿ‡ญ Cambodia2.67%5.81%26.43%
๐Ÿ‡จ๐Ÿ‡ฒ Cameroon3.47%2.67%11.89%
๐Ÿ‡จ๐Ÿ‡ฆ Canada7.7%19.03%31.55%
๐Ÿ‡จ๐Ÿ‡ป Cape Verde3.67%5.55%32.63%
๐Ÿ‡ฐ๐Ÿ‡พ Cayman Islands6.05%8.17%28.75%
๐Ÿ‡จ๐Ÿ‡ซ Central African Republic5.%2.51%11.43%
๐Ÿ‡น๐Ÿ‡ฉ Chad4.33%2.01%9.64%
๐Ÿ‡จ๐Ÿ‡ฑ Chile3.3%13.03%36.61%
๐Ÿ‡จ๐Ÿ‡ณ China5.04%13.72%40.93%
๐Ÿ‡จ๐Ÿ‡ด Colombia3.22%9.%34.49%
๐Ÿ‡ฐ๐Ÿ‡ฒ Comoros3.8%4.28%17.81%
๐Ÿ‡จ๐Ÿ‡ฌ Congo3.36%2.72%11.99%
๐Ÿ‡จ๐Ÿ‡ฐ Cook Islands2.94%11.73%29.75%
๐Ÿ‡จ๐Ÿ‡ท Costa Rica2.97%10.83%36.99%
๐Ÿ‡จ๐Ÿ‡ฎ Cote d'Ivoire2.21%2.4%10.86%
๐Ÿ‡ญ๐Ÿ‡ท Croatia7.82%22.36%37.03%
๐Ÿ‡จ๐Ÿ‡บ Cuba4.36%15.81%36.31%
๐Ÿ‡จ๐Ÿ‡ผ Curacao5.82%14.95%30.46%
๐Ÿ‡จ๐Ÿ‡พ Cyprus5.95%14.83%33.36%
๐Ÿ‡จ๐Ÿ‡ฟ Czechia8.29%20.64%26.94%
๐Ÿ‡จ๐Ÿ‡ฉ Democratic Republic of Congo3.77%2.92%10.62%
๐Ÿ‡ฉ๐Ÿ‡ฐ Denmark9.04%20.49%30.45%
๐Ÿ‡ฉ๐Ÿ‡ฏ Djibouti1.99%4.54%19.68%
๐Ÿ‡ฉ๐Ÿ‡ฒ Dominica7.67%9.53%34.28%
๐Ÿ‡ฉ๐Ÿ‡ด Dominican Republic2.72%7.4%30.47%
๐Ÿ‡ช๐Ÿ‡จ Ecuador5.2%7.83%31.97%
๐Ÿ‡ช๐Ÿ‡ฌ Egypt2.95%4.83%21.77%
๐Ÿ‡ธ๐Ÿ‡ป El Salvador3.93%8.22%36.02%
๐Ÿ‡ฌ๐Ÿ‡ถ Equatorial Guinea5.53%3.12%15.13%
๐Ÿ‡ช๐Ÿ‡ท Eritrea3.2%4.01%19.86%
๐Ÿ‡ช๐Ÿ‡ช Estonia10.56%20.58%34.15%
๐Ÿ‡ธ๐Ÿ‡ฟ Eswatini2.68%4.%16.26%
๐Ÿ‡ช๐Ÿ‡น Ethiopia3.01%3.14%18.6%
๐Ÿ‡ซ๐Ÿ‡ด Faeroe Islands7.59%17.92%26.91%
๐Ÿ‡ซ๐Ÿ‡ฐ Falkland Islands8.27%11.08%35.86%
๐Ÿ‡ซ๐Ÿ‡ฏ Fiji5.99%5.9%20.6%
๐Ÿ‡ซ๐Ÿ‡ฎ Finland6.63%23.27%34.04%
๐Ÿ‡ซ๐Ÿ‡ท France11.39%21.66%34.23%
๐Ÿ‡ฌ๐Ÿ‡ซ French Guiana7.96%5.98%21.13%
๐Ÿ‡ต๐Ÿ‡ซ French Polynesia3.%10.07%37.85%
๐Ÿ‡ฌ๐Ÿ‡ฆ Gabon7.21%3.89%16.25%
๐Ÿ‡ฌ๐Ÿ‡ฒ Gambia2.5%2.43%16.06%
๐Ÿ‡ฌ๐Ÿ‡ช Georgia9.35%14.61%31.19%
๐Ÿ‡ฉ๐Ÿ‡ช Germany9.46%22.41%33.72%
๐Ÿ‡ฌ๐Ÿ‡ญ Ghana4.62%3.55%15.91%
๐Ÿ‡ฌ๐Ÿ‡ฎ Gibraltar6.94%20.84%37.63%
๐Ÿ‡ฌ๐Ÿ‡ท Greece6.8%22.82%37.52%
๐Ÿ‡ฌ๐Ÿ‡ฑ Greenland3.06%10.02%29.16%
๐Ÿ‡ฌ๐Ÿ‡ฉ Grenada5.12%10.07%30.54%
๐Ÿ‡ฌ๐Ÿ‡ต Guadeloupe5.51%20.04%34.45%
๐Ÿ‡ฌ๐Ÿ‡บ Guam1.11%11.84%31.19%
๐Ÿ‡ฌ๐Ÿ‡น Guatemala2.31%4.91%28.05%
๐Ÿ‡ฌ๐Ÿ‡ฌ Guernsey11.96%16.64%35.4%
๐Ÿ‡ฌ๐Ÿ‡ณ Guinea5.39%3.32%14.%
๐Ÿ‡ฌ๐Ÿ‡ผ Guinea-Bissau3.45%2.82%14.34%
๐Ÿ‡ฌ๐Ÿ‡พ Guyana3.89%6.28%28.94%
๐Ÿ‡ญ๐Ÿ‡น Haiti3.64%4.54%19.07%
๐Ÿ‡ญ๐Ÿ‡ณ Honduras3.96%4.27%26.5%
๐Ÿ‡ญ๐Ÿ‡ฐ Hong Kong2.48%20.47%41.64%
๐Ÿ‡ญ๐Ÿ‡บ Hungary7.81%20.01%31.85%
๐Ÿ‡ฎ๐Ÿ‡ธ Iceland7.52%15.33%34.25%
๐Ÿ‡ฎ๐Ÿ‡ณ India3.1%6.9%29.81%
๐Ÿ‡ฎ๐Ÿ‡ฉ Indonesia1.74%6.86%25.28%
๐Ÿ‡ฎ๐Ÿ‡ท Iran5.22%7.62%33.72%
๐Ÿ‡ฎ๐Ÿ‡ถ Iraq2.79%3.41%18.44%
๐Ÿ‡ฎ๐Ÿ‡ช Ireland10.99%15.14%32.48%
๐Ÿ‡ฎ๐Ÿ‡ฒ Isle of Man13.9%22.29%31.8%
๐Ÿ‡ฎ๐Ÿ‡ฑ Israel4.%12.04%25.97%
๐Ÿ‡ฎ๐Ÿ‡น Italy8.09%24.05%38.19%
๐Ÿ‡ฏ๐Ÿ‡ฒ Jamaica3.83%7.45%44.05%
๐Ÿ‡ฏ๐Ÿ‡ต Japan4.89%29.92%38.7%
๐Ÿ‡ฏ๐Ÿ‡ช Jersey12.34%16.22%30.52%
๐Ÿ‡ฏ๐Ÿ‡ด Jordan5.03%3.84%27.3%
๐Ÿ‡ฐ๐Ÿ‡ฟ Kazakhstan6.47%8.04%19.58%
๐Ÿ‡ฐ๐Ÿ‡ช Kenya5.28%2.87%16.98%
๐Ÿ‡ฐ๐Ÿ‡ฎ Kiribati7.13%3.81%17.33%
๐Ÿ‡ฝ๐Ÿ‡ฐ Kosovo5.33%10.19%43.35%
๐Ÿ‡ฐ๐Ÿ‡ผ Kuwait2.88%4.93%31.56%
๐Ÿ‡ฐ๐Ÿ‡ฌ Kyrgyzstan7.91%4.54%21.08%
๐Ÿ‡ฑ๐Ÿ‡ฆ Laos2.13%4.45%25.24%
๐Ÿ‡ฑ๐Ÿ‡ป Latvia10.12%21.86%32.86%
๐Ÿ‡ฑ๐Ÿ‡ง Lebanon7.24%9.89%32.11%
๐Ÿ‡ฑ๐Ÿ‡ธ Lesotho6.34%4.2%13.44%
๐Ÿ‡ฑ๐Ÿ‡ท Liberia2.97%3.31%13.88%
๐Ÿ‡ฑ๐Ÿ‡พ Libya5.21%4.86%27.77%
๐Ÿ‡ฑ๐Ÿ‡ฎ Liechtenstein7.89%19.37%34.79%
๐Ÿ‡ฑ๐Ÿ‡น Lithuania8.65%20.8%32.79%
๐Ÿ‡ฑ๐Ÿ‡บ Luxembourg9.71%15.03%31.55%
๐Ÿ‡ฒ๐Ÿ‡ด Macao3.11%13.%32.39%
๐Ÿ‡ฒ๐Ÿ‡ฌ Madagascar3.25%3.35%16.21%
๐Ÿ‡ฒ๐Ÿ‡ผ Malawi3.06%2.61%15.61%
๐Ÿ‡ฒ๐Ÿ‡พ Malaysia4.91%7.5%30.78%
๐Ÿ‡ฒ๐Ÿ‡ป Maldives3.14%4.78%35.61%
๐Ÿ‡ฒ๐Ÿ‡ฑ Mali2.78%2.38%11.%
๐Ÿ‡ฒ๐Ÿ‡น Malta7.42%19.13%38.26%
๐Ÿ‡ฒ๐Ÿ‡ญ Marshall Islands5.68%4.56%17.8%
๐Ÿ‡ฒ๐Ÿ‡ถ Martinique5.85%22.77%37.31%
๐Ÿ‡ฒ๐Ÿ‡ท Mauritania1.44%3.22%15.03%
๐Ÿ‡ฒ๐Ÿ‡บ Mauritius3.18%12.79%33.76%
๐Ÿ‡พ๐Ÿ‡น Mayotte6.61%2.88%18.15%
๐Ÿ‡ฒ๐Ÿ‡ฝ Mexico2.99%8.32%34.88%
๐Ÿ‡ซ๐Ÿ‡ฒ Micronesia (country)4.11%6.16%27.59%
๐Ÿ‡ฒ๐Ÿ‡ฉ Moldova7.56%12.98%26.36%
๐Ÿ‡ฒ๐Ÿ‡จ Monaco15.64%35.92%30.16%
๐Ÿ‡ฒ๐Ÿ‡ณ Mongolia3.87%4.61%26.18%
๐Ÿ‡ฒ๐Ÿ‡ช Montenegro7.85%16.55%34.16%
๐Ÿ‡ฒ๐Ÿ‡ธ Montserrat7.92%17.7%33.05%
๐Ÿ‡ฒ๐Ÿ‡ฆ Morocco2.86%7.72%29.97%
๐Ÿ‡ฒ๐Ÿ‡ฟ Mozambique3.13%2.57%13.43%
๐Ÿ‡ฒ๐Ÿ‡ฒ Myanmar3.21%6.82%23.69%
๐Ÿ‡ณ๐Ÿ‡ฆ Namibia4.1%3.97%15.38%
๐Ÿ‡ณ๐Ÿ‡ท Nauru8.98%2.5%15.87%
๐Ÿ‡ณ๐Ÿ‡ต Nepal2.74%6.09%29.51%
๐Ÿ‡ณ๐Ÿ‡ฑ Netherlands7.76%20.31%32.89%
๐Ÿ‡ณ๐Ÿ‡จ New Caledonia5.%11.02%31.61%
๐Ÿ‡ณ๐Ÿ‡ฟ New Zealand9.09%16.31%33.2%
๐Ÿ‡ณ๐Ÿ‡ฎ Nicaragua2.71%5.29%28.92%
๐Ÿ‡ณ๐Ÿ‡ช Niger.92%2.4%9.76%
๐Ÿ‡ณ๐Ÿ‡ฌ Nigeria3.%2.97%12.31%
๐Ÿ‡ณ๐Ÿ‡บ Niue4.79%15.16%22.55%
๐Ÿ‡ฐ๐Ÿ‡ต North Korea2.72%11.71%30.49%
๐Ÿ‡ฒ๐Ÿ‡ฐ North Macedonia5.87%14.91%36.56%
๐Ÿ‡ฒ๐Ÿ‡ต Northern Mariana Islands2.95%10.81%32.09%
๐Ÿ‡ณ๐Ÿ‡ด Norway9.52%18.44%31.65%
๐Ÿ‡ด๐Ÿ‡ฒ Oman3.05%2.76%23.96%
๐Ÿ‡ต๐Ÿ‡ฐ Pakistan5.48%4.27%17.23%
๐Ÿ‡ต๐Ÿ‡ผ Palau8.59%9.93%21.48%
๐Ÿ‡ต๐Ÿ‡ธ Palestine4.77%3.53%23.44%
๐Ÿ‡ต๐Ÿ‡ฆ Panama3.57%8.77%30.03%
๐Ÿ‡ต๐Ÿ‡ฌ Papua New Guinea1.09%3.19%16.81%
๐Ÿ‡ต๐Ÿ‡พ Paraguay3.73%6.26%26.51%
๐Ÿ‡ต๐Ÿ‡ช Peru3.43%8.41%30.33%
๐Ÿ‡ต๐Ÿ‡ญ Philippines3.56%5.44%23.38%
๐Ÿ‡ต๐Ÿ‡ฑ Poland5.22%18.55%35.69%
๐Ÿ‡ต๐Ÿ‡น Portugal7.%22.9%36.28%
๐Ÿ‡ต๐Ÿ‡ท Puerto Rico3.63%22.93%48.9%
๐Ÿ‡ถ๐Ÿ‡ฆ Qatar3.5%1.52%15.01%
๐Ÿ‡ท๐Ÿ‡ช Reunion3.81%13.28%32.4%
๐Ÿ‡ท๐Ÿ‡ด Romania7.16%18.64%32.22%
๐Ÿ‡ท๐Ÿ‡บ Russia4.8%15.8%27.86%
๐Ÿ‡ท๐Ÿ‡ผ Rwanda2.76%3.2%17.36%
๐Ÿ‡ง๐Ÿ‡ฑ Saint Barthlemy7.3%10.61%43.89%
๐Ÿ‡ธ๐Ÿ‡ญ Saint Helena8.63%28.66%32.61%
๐Ÿ‡ฐ๐Ÿ‡ณ Saint Kitts and Nevis5.36%10.13%29.79%
๐Ÿ‡ฑ๐Ÿ‡จ Saint Lucia3.59%9.23%33.39%
๐Ÿ‡ฒ๐Ÿ‡ซ Saint Martin (French part)4.47%11.14%30.08%
๐Ÿ‡ต๐Ÿ‡ฒ Saint Pierre and Miquelon6.34%17.32%33.4%
๐Ÿ‡ป๐Ÿ‡จ Saint Vincent and the Grenadines7.71%10.86%32.34%
๐Ÿ‡ผ๐Ÿ‡ธ Samoa2.52%5.22%18.75%
๐Ÿ‡ธ๐Ÿ‡ฒ San Marino10.15%20.47%35.73%
๐Ÿ‡ธ๐Ÿ‡น Sao Tome and Principe3.92%3.76%15.6%
๐Ÿ‡ธ๐Ÿ‡ฆ Saudi Arabia3.32%2.81%30.28%
๐Ÿ‡ธ๐Ÿ‡ณ Senegal3.42%3.14%16.54%
๐Ÿ‡ท๐Ÿ‡ธ Serbia6.15%20.56%37.55%
๐Ÿ‡ธ๐Ÿ‡จ Seychelles10.68%8.16%28.84%
๐Ÿ‡ธ๐Ÿ‡ฑ Sierra Leone3.02%3.14%15.52%
๐Ÿ‡ธ๐Ÿ‡ฌ Singapore2.29%15.12%36.51%
๐Ÿ‡ธ๐Ÿ‡ฝ Sint Maarten (Dutch part)12.03%10.57%34.51%
๐Ÿ‡ธ๐Ÿ‡ฐ Slovakia6.63%16.98%33.4%
๐Ÿ‡ธ๐Ÿ‡ฎ Slovenia7.52%20.96%33.59%
๐Ÿ‡ธ๐Ÿ‡ง Solomon Islands4.03%3.47%15.29%
๐Ÿ‡ธ๐Ÿ‡ด Somalia2.6%2.57%10.75%
๐Ÿ‡ฟ๐Ÿ‡ฆ South Africa4.06%5.89%20.55%
๐Ÿ‡ฐ๐Ÿ‡ท South Korea2.74%17.49%44.44%
๐Ÿ‡ธ๐Ÿ‡ธ South Sudan3.48%2.89%13.11%
๐Ÿ‡ช๐Ÿ‡ธ Spain7.23%20.27%38.72%
๐Ÿ‡ฑ๐Ÿ‡ฐ Sri Lanka8.76%11.54%35.73%
๐Ÿ‡ธ๐Ÿ‡ฉ Sudan3.03%3.5%13.28%
๐Ÿ‡ธ๐Ÿ‡ท Suriname4.09%7.39%25.8%
๐Ÿ‡ธ๐Ÿ‡ช Sweden10.19%20.25%31.83%
๐Ÿ‡จ๐Ÿ‡ญ Switzerland9.49%19.31%32.61%
๐Ÿ‡ธ๐Ÿ‡พ Syria7.66%4.68%24.62%
๐Ÿ‡น๐Ÿ‡ผ Taiwan2.11%16.71%37.32%
๐Ÿ‡น๐Ÿ‡ฏ Tajikistan4.34%3.47%19.43%
๐Ÿ‡น๐Ÿ‡ฟ Tanzania2.2%3.1%14.97%
๐Ÿ‡น๐Ÿ‡ญ Thailand3.21%15.21%39.17%
๐Ÿ‡น๐Ÿ‡ฑ Timor3.14%5.21%25.42%
๐Ÿ‡น๐Ÿ‡ฌ Togo4.29%3.13%11.77%
๐Ÿ‡น๐Ÿ‡ฐ Tokelau4.7%8.66%25.03%
๐Ÿ‡น๐Ÿ‡ด Tonga4.6%6.22%21.65%
๐Ÿ‡น๐Ÿ‡น Trinidad and Tobago3.93%11.52%32.67%
๐Ÿ‡น๐Ÿ‡ณ Tunisia4.4%9.02%31.24%
๐Ÿ‡น๐Ÿ‡ท Turkey3.77%8.64%33.9%
๐Ÿ‡น๐Ÿ‡ฒ Turkmenistan5.84%5.15%21.55%
๐Ÿ‡น๐Ÿ‡จ Turks and Caicos Islands5.79%10.34%28.25%
๐Ÿ‡น๐Ÿ‡ป Tuvalu4.98%6.48%16.15%
๐Ÿ‡บ๐Ÿ‡ฌ Uganda2.87%1.69%14.33%
๐Ÿ‡บ๐Ÿ‡ฆ Ukraine7.54%18.81%33.2%
๐Ÿ‡ฆ๐Ÿ‡ช United Arab Emirates3.35%1.83%15.77%
๐Ÿ‡ฌ๐Ÿ‡ง United Kingdom10.84%19.17%32.56%
๐Ÿ‡บ๐Ÿ‡ธ United States8.18%17.13%30.47%
๐Ÿ‡ป๐Ÿ‡ฎ United States Virgin Islands7.54%20.42%39.11%
๐Ÿ‡บ๐Ÿ‡พ Uruguay8.23%15.58%35.98%
๐Ÿ‡บ๐Ÿ‡ฟ Uzbekistan5.87%5.14%22.24%
๐Ÿ‡ป๐Ÿ‡บ Vanuatu5.65%3.74%16.29%
๐Ÿ‡ป๐Ÿ‡ช Venezuela2.29%8.61%27.71%
๐Ÿ‡ป๐Ÿ‡ณ Vietnam4.13%9.12%30.02%
๐Ÿ‡ผ๐Ÿ‡ซ Wallis and Futuna1.76%13.47%32.98%
๐Ÿ‡ช๐Ÿ‡ญ Western Sahara2.82%5.84%23.73%
๐Ÿ‡พ๐Ÿ‡ช Yemen3.98%2.66%18.25%
๐Ÿ‡ฟ๐Ÿ‡ฒ Zambia2.76%1.75%12.66%
๐Ÿ‡ฟ๐Ÿ‡ผ Zimbabwe3.18%3.32%14.22%
๐ŸŒ World5.13%9.82%24.03%

Some of the places with high elderly shares today include high-income countries like Japan (30%), Italy (24%), and Finland (23%).

The lowest shares are concentrated in the Middle East and Africa. Many countries have just 2% of their population aged 65 years and older, such as Qatar, Uganda, and Afghanistan.

But over time, almost all countries are expected to see their older population segments grow. In just three decades, it is estimated that one-in-four European, North American, and Asian residents will be over 65 years of age.

By 2100, a variety of Asian countries and island nations facing low population growth are expected to see more than one-third of their populations aged 65 years or older, including South Korea and Jamaica at 44%. However, it’s actually Albania that’s the biggest outlier overall, with a projected 49% of its population to be aged 65 and older by 2100.

Passing the Generational Torch

The challenge of an aging population is set to impact all sectors of society, including labor and financial markets, demand for housing and transportation, and especially family structures and intergenerational ties.

One way to help grasp the nature of transition is to note the changing ratio between seniors and young children in the world population, as seen in the below crossover diagram:

Elderly population surpass that of children aged 5 and below

Dropping fertility rates, in addition to improved child and infant mortality rates, are known to have played a major role in the plateauing population of children.

However, not all countries have witnessed this crossover yet, as it usually coincides with higher levels of economic development.

As countries such as India, Brazil, and South Africa reach higher levels of per capita income, they will be likely to follow down the paths of more advanced economies, eventually experiencing similar demographic fates and challenges.

Continue Reading

Subscribe

Popular