Healthcare
How Big Data Will Unlock the Potential of Healthcare

How Big Data Will Unlock the Potential of Healthcare
Data is driving the future of business, and any company not prepared for this transformation is at risk of being left behind.
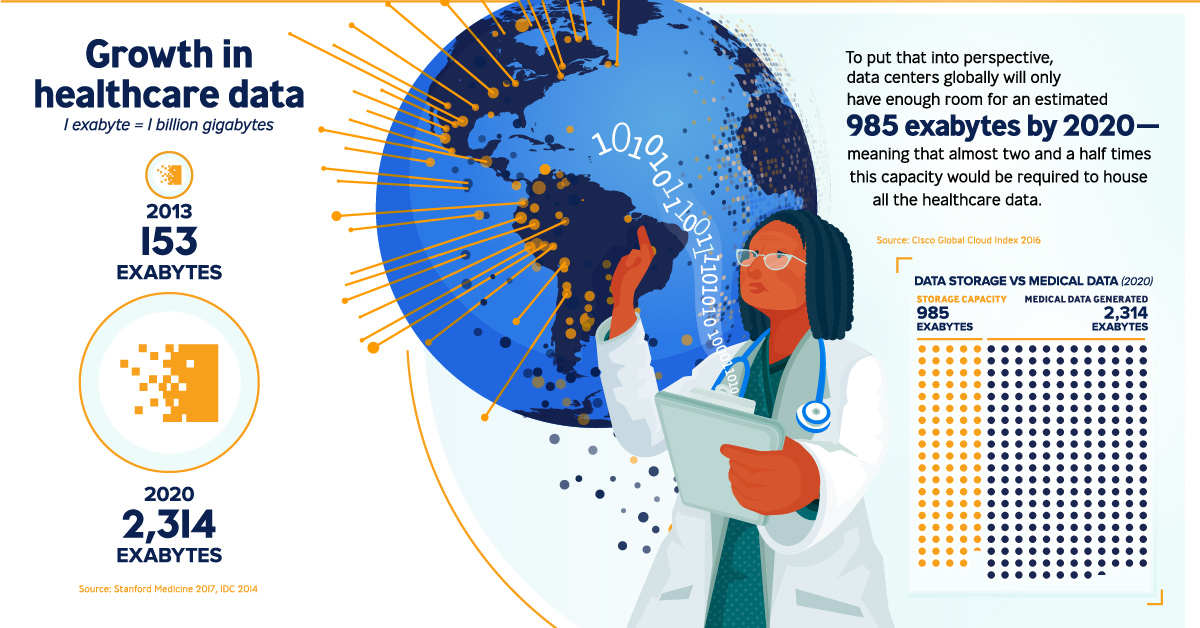
This is a reality in almost every sector, but it’s especially relevant to companies in the healthcare industry. That’s because the amount of health data being created is growing at a 48% rate annually, and by 2020, a Stanford University study estimates that 2,314 exabytes of healthcare data will be produced per year.
Simply put, the companies that can extract meaningful insights from these mountains of data will have a serious and durable competitive advantage – and those that don’t have a proper strategy for this boom in data will get lost in the weeds.
Breaking Down Big Data
Today’s infographic comes to us from Publicis Health, and it shows why big data is one of the six forces transforming the life sciences and pharmaceuticals industries.
Big data in healthcare spans four different dimensions:
Volume
The sheer amount of data created can be processed and interpreted by AI.
Veracity
Noise, abnormality, and biases can undermine trust and accuracy of data. Data assurance can help guarantee analytics are credible and error-free.
Velocity
Healthcare is time sensitive, and being able to process large amounts of data in real-time is crucial.
Variety
Big data comes from a myriad of sources, such as social media or IoT devices. Actionable insights can be gained from analyzing different data sources together.
Healthcare businesses must learn to quickly distill information from masses of data and to transform them into actionable insights. The ability to extract these insights will power the future of health, and become a differentiator for companies to thrive and stay ahead of emerging competitors.
Analytical Nirvana
How can companies reach “analytical nirvana”, a state where analytics can be used for strategic differentiation?
Companies must move towards being more service-focused, by transforming data into compelling stories that bridge the gap between customer engagement and action.
Further, this change must be powered by predictive health intelligence that can interpret data to create more personalized experiences for customers. Finally, data must be democratized throughout an organization, so that even non-analysts can deploy gained insights to achieve these other goals.
This journey may seem like a daunting task, but companies that successfully navigate this transformation will gain an edge that will continue to grow in importance in the digital era.
This is part two of a seven part series. Stay tuned by subscribing to Visual Capitalist for free, as we go into these six forces in more detail in the future.
Healthcare
The Cost of an EpiPen in Major Markets
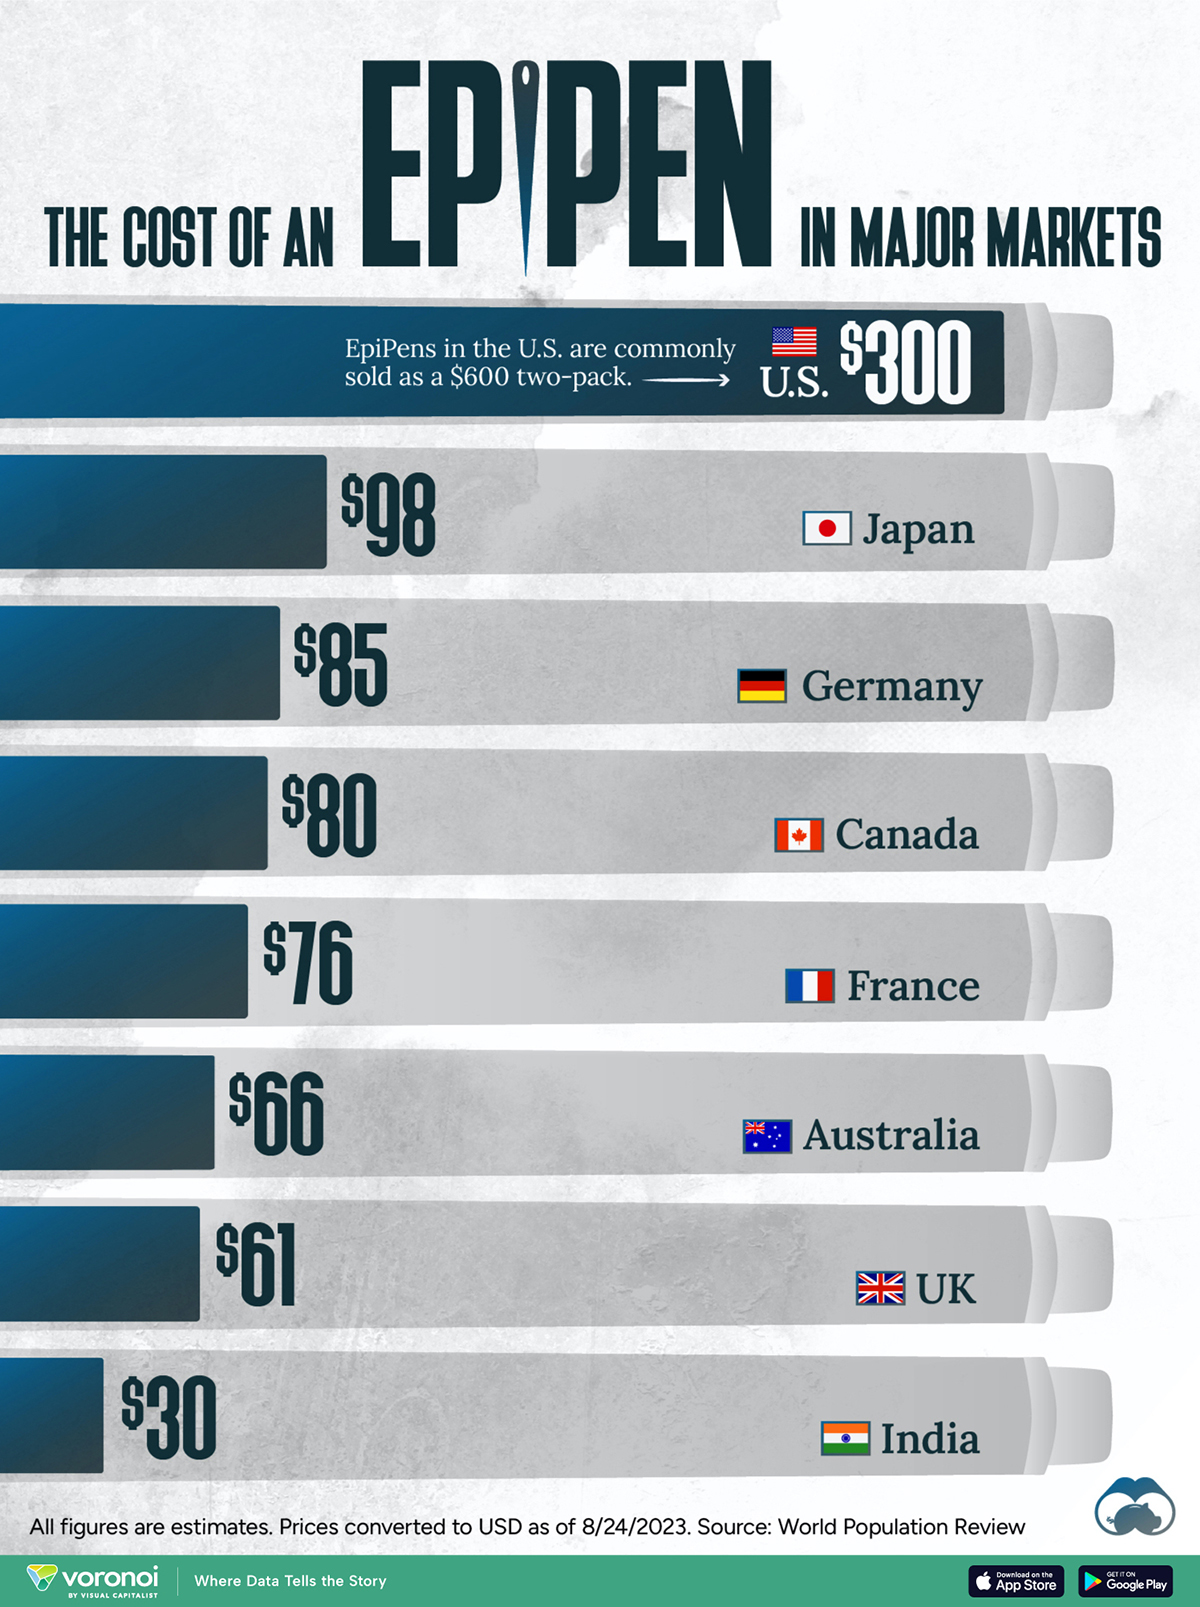
This visualization compares EpiPen prices around the world, with the U.S. having the highest prices by far.

The Cost of an EpiPen in Major Markets
This was originally posted on our Voronoi app. Download the app for free on iOS or Android and discover incredible data-driven charts from a variety of trusted sources.
EpiPens are auto-injectors containing epinephrine, a drug that can treat or reverse severe allergic reactions, potentially preventing death.
The global epinephrine market was valued at $1.75 billion in 2022 and is projected to reach $4.08 billion by 2030. North America represents over 60% of the market.
EpiPens, however, can be prohibitively expensive in some regions.
In this graphic, we present estimated EpiPen prices in major global markets, compiled by World Population Review and converted to U.S. dollars as of August 2023.
Why are U.S. Prices so High?
The U.S. stands out as the most expensive market for EpiPens, despite over 1 million Americans having epinephrine prescriptions. After Mylan (now part of Pfizer) acquired the rights to produce EpiPens in the U.S. in 2007, the cost of a two-pack skyrocketed to $600, up from about $60.
| Country | Price (USD) |
|---|---|
| 🇺🇸 U.S. | 300* |
| 🇯🇵 Japan | 98 |
| 🇩🇪 Germany | 85 |
| 🇨🇦 Canada | 80 |
| 🇫🇷 France | 76 |
| 🇦🇺 Australia | 66 |
| 🇬🇧 UK | 61 |
| 🇮🇳 India | 30 |
*Per unit cost. Commonly sold as a two-pack, meaning total cost is equal to $600
Former Mylan CEO Heather Bresch defended the price hikes to Congress, citing minimal profit margins. Mylan eventually settled with the U.S. government for a nine-figure sum.
Notably, EpiPens are available at a fraction of the cost in other developed countries like Japan, Germany, and Canada.
Making EpiPens More Affordable
Efforts to improve EpiPen affordability are underway in several U.S. states. For instance, the Colorado House approved a $60 price cap on epinephrine, now under review by the state Senate.
Similar measures in Rhode Island, Delaware, Missouri, and Vermont aim to ensure insurance coverage for epinephrine, which is not currently mandatory, although most health plans cover it.
-

 Mining1 week ago
Gold vs. S&P 500: Which Has Grown More Over Five Years?
-

 Markets2 weeks ago
Ranked: The Most Valuable Housing Markets in America
-

 Money2 weeks ago
Which States Have the Highest Minimum Wage in America?
-

 AI2 weeks ago
Ranked: Semiconductor Companies by Industry Revenue Share
-

 Markets2 weeks ago
Ranked: The World’s Top Flight Routes, by Revenue
-

 Countries2 weeks ago
Population Projections: The World’s 6 Largest Countries in 2075
-

 Markets2 weeks ago
The Top 10 States by Real GDP Growth in 2023
-

 Demographics2 weeks ago
The Smallest Gender Wage Gaps in OECD Countries


