This graphic compares the nominal vs. inflation-adjusted value of the U.S. minimum wage, from 1940 to 2023.


click for more →


Scan with your phone's camera or QR code app to view
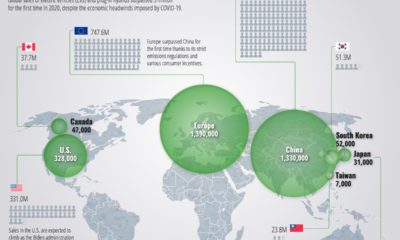

Europe was the global leader in EV sales for the first time in 2020, surpassing China by a thin margin of just 60,000 cars.
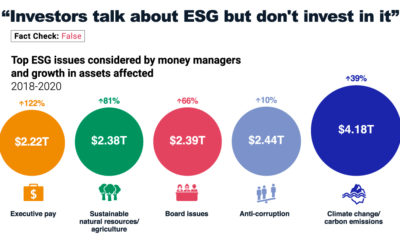

ESG investing continues to break fund inflow records. In this infographic, we unpack five common ESG myths.
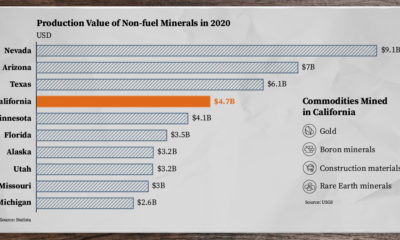

California is known as the Golden State for its rich history of gold mining. Today, it remains one of the largest states for mining in the...
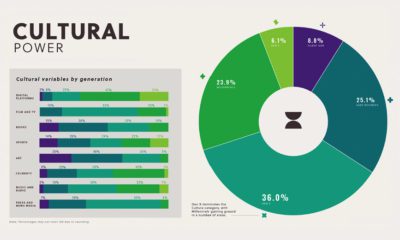

Visual Capitalist's first-ever Generational Power Index looks at which U.S. generation holds the most cultural influence in American society.

How is the growing cybersecurity market evolving? This graphic highlights the core technology developments and market growth underway.
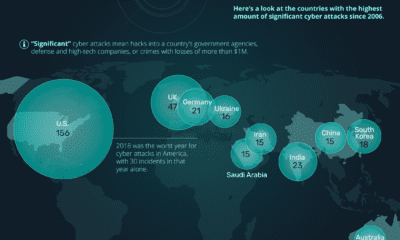

Cyber crime is expected to cost the global economy trillions per year by 2025. Here are the countries with the most severe cyber attacks from 2006-2020.
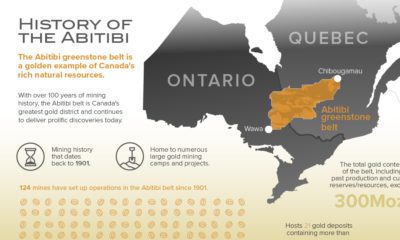

The Abitibi greenstone belt has produced more than 200 million ounces of gold since 1901. Learn more about the Abitibi belt's history, mining activity, and potential...


Lumber prices in the U.S. continue to break records as pressure from both the supply and demand sides of the market collide.
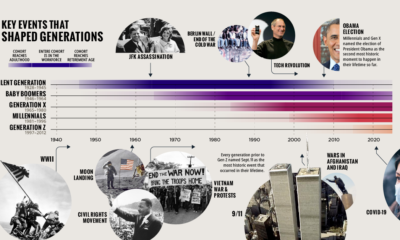

This timeline, from our Generational Power Index report, explores defining events in U.S. history that impacted each generation.


Aritifical Intelligence becoming increasingly more prevalent in healthcare. Here are 7 ways this growth might impact the industry as a whole.
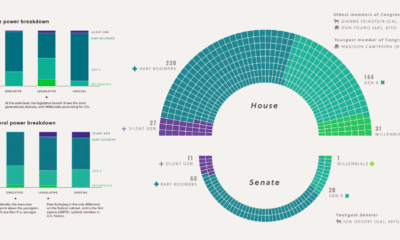

Visual Capitalist's inaugural Generational Power Index (GPI) examines the political power held by each generation and their influence on society.
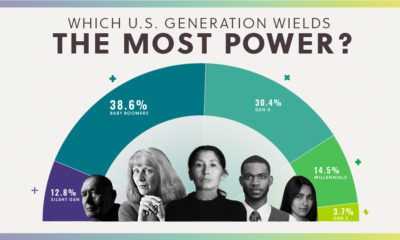

Using data from our new Generational Power Index, we look at how much economic, political, and cultural power each U.S. generation holds.


Despite its lack of fanfare, antimony is a critical mineral that plays an important role in the mass storage of renewable energy.
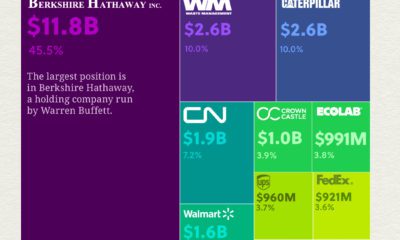

The Bill and Melinda Gates Foundation is funded by a trust that has a portfolio value of over $25 billion. Here's how it invests its assets.
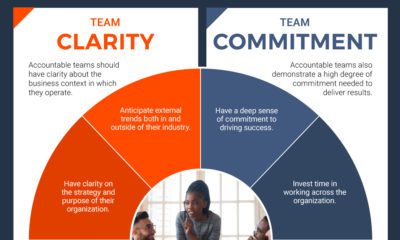

Roughly 80% of teams are seen as mediocre or weak. This graphic explores the strategies leaders can use to create accountable teams.


This month, we dive into bonus content from our new Generational Power Index, as well as topical visualizations in the news.
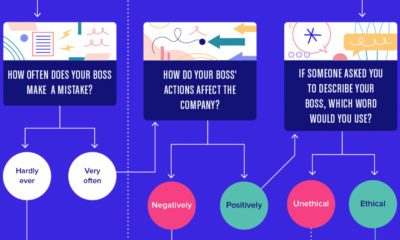

Most people have had bad bosses, but is your boss toxic? This flowchart helps you discover if you have a toxic boss and what to do...