Politics
Canada has the Most Overvalued Housing Market in World [Chart]
![Canada has the Most Overvalued Housing Market in World [Chart]](https://www.visualcapitalist.com/wp-content/uploads/2015/05/canada-housing-bubble.png)
Canada has the Most Overvalued Housing Market in World [Chart]
The Chart of the Week is a weekly feature in Visual Capitalist on Fridays.
In every inflating bubble, there’s usually two camps. The first group points out various metrics suggesting something is inherently unsustainable, while the second reiterates that this time, it is different.
After all, if everyone always agreed on these things, then no one would do the buying to perpetuate the bubble’s expansion. The Canadian housing bubble has been no exception to this, and the war of words is starting to heat up.
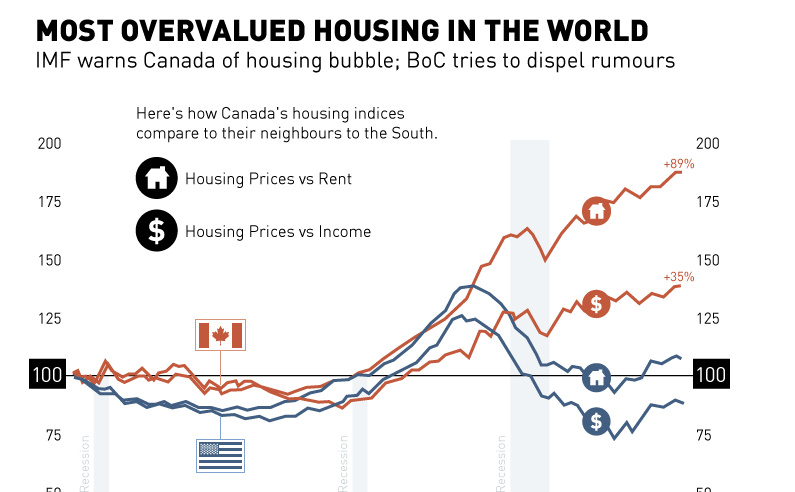
On one side of the ring, we have The Economist, that came out last week saying Canada has the most overvalued housing market in the world. After crunching the data in housing markets in 26 nations, The Economist has determined that Canada’s property market is the most overvalued in terms of rent prices (+89%), and the third most overvalued in terms of incomes (+35%). They have mentioned in the past that the market has looked bubbly for some time, but finally Canada is officially at the top of their list.
Of course, The Economist is not the only fighter on this side of the ring.
Just over a month ago, the IMF sounded a fresh alarm on Canada’s housing market by saying that household debt is well above that of other countries. Meanwhile, seven in ten mortgage lenders in Canada have expressed “concerns” that the real estate sector is in a bubble that could burst at any time. Deutsch Bank estimates the market is 63% overvalued and readily offers seven reasons why Canada is in trouble. Even hedge funds are starting to find ways to short the market in anticipation of an upcoming collapse. Canada’s housing situation could give rise to the world’s next Steve Eisman, Eugene Xu, or Greg Lippmann.
On the opposing side of the ring, who will contend that the Canadian housing market is just different this time? Hint: look to the banks and government.
Stephen Harper, Canada’s Prime Minister, has tried to dispel fears. He recently told a business audience in New York that he didn’t anticipate any housing crisis in Canada.
Just this week, the Bank of Canada also tried its best to deflate housing bubble fears. “We don’t believe we’re in a bubble,” says Stephen Poloz, the Bank’s Governor. “Our housing construction has stayed very much in line with our estimates of demographic demand.”
Poloz suggested that housing costs do not necessarily have to contract to match the incomes of Canadians. Instead, he expects growth in the economy to raise wages and make housing more affordable.
Strangely enough, by the Bank of Canada’s own estimate, the housing market is overvalued by as much as 30%. It is hard for housing to become more affordable when prices are rising in double digits in a year. Combine this with the fact that household debt rates keep setting new records, and one side of the fight might get tilted sooner than later.


Economy
The Bloc Effect: International Trade with Geopolitical Allies on the Rise
Rising geopolitical tensions are shaping the future of international trade, but what is the effect on trading among G7 and BRICS countries?


The Bloc Effect: International Trade with Allies on the Rise
International trade has become increasingly fragmented over the last five years as countries have shifted to trading more with their geopolitical allies.
This graphic from The Hinrich Foundation, the first in a three-part series covering the future of trade, provides visual context to the growing divide in trade in G7 and pre-expansion BRICS countries, which are used as proxies for geopolitical blocs.
Trade Shifts in G7 and BRICS Countries
This analysis uses IMF data to examine differences in shares of exports within and between trading blocs from 2018 to 2023. For example, we looked at the percentage of China’s exports with other BRICS members as well as with G7 members to see how these proportions shifted in percentage points (pp) over time.
Countries traded nearly $270 billion more with allies in 2023 compared to 2018. This shift came at the expense of trade with rival blocs, which saw a decline of $314 billion.
Country Change in Exports Within Bloc (pp) Change in Exports With Other Bloc (pp)
🇮🇳 India 0.0 3.9
🇷🇺 Russia 0.7 -3.8
🇮🇹 Italy 0.8 -0.7
🇨🇦 Canada 0.9 -0.7
🇫🇷 France 1.0 -1.1
🇪🇺 EU 1.1 -1.5
🇩🇪 Germany 1.4 -2.1
🇿🇦 South Africa 1.5 1.5
🇺🇸 U.S. 1.6 -0.4
🇯🇵 Japan 2.0 -1.7
🇨🇳 China 2.1 -5.2
🇧🇷 Brazil 3.7 -3.3
🇬🇧 UK 10.2 0.5
All shifts reported are in percentage points. For example, the EU saw its share of exports to G7 countries rise from 74.3% in 2018 to 75.4% in 2023, which equates to a 1.1 percentage point increase.
The UK saw the largest uptick in trading with other countries within the G7 (+10.2 percentage points), namely the EU, as the post-Brexit trade slump to the region recovered.
Meanwhile, the U.S.-China trade dispute caused China’s share of exports to the G7 to fall by 5.2 percentage points from 2018 to 2023, the largest decline in our sample set. In fact, partly as a result of the conflict, the U.S. has by far the highest number of harmful tariffs in place.
The Russia-Ukraine War and ensuing sanctions by the West contributed to Russia’s share of exports to the G7 falling by 3.8 percentage points over the same timeframe.
India, South Africa, and the UK bucked the trend and continued to witness advances in exports with the opposing bloc.
Average Trade Shifts of G7 and BRICS Blocs
Though results varied significantly on a country-by-country basis, the broader trend towards favoring geopolitical allies in international trade is clear.
Bloc Change in Exports Within Bloc (pp) Change in Exports With Other Bloc (pp)
Average 2.1 -1.1
BRICS 1.6 -1.4
G7 incl. EU 2.4 -1.0
Overall, BRICS countries saw a larger shift away from exports with the other bloc, while for G7 countries the shift within their own bloc was more pronounced. This implies that though BRICS countries are trading less with the G7, they are relying more on trade partners outside their bloc to make up for the lost G7 share.
A Global Shift in International Trade and Geopolitical Proximity
The movement towards strengthening trade relations based on geopolitical proximity is a global trend.
The United Nations categorizes countries along a scale of geopolitical proximity based on UN voting records.
According to the organization’s analysis, international trade between geopolitically close countries rose from the first quarter of 2022 (when Russia first invaded Ukraine) to the third quarter of 2023 by over 6%. Conversely, trade with geopolitically distant countries declined.
The second piece in this series will explore China’s gradual move away from using the U.S. dollar in trade settlements.
Visit the Hinrich Foundation to learn more about the future of geopolitical trade

-

 Economy2 days ago
Economic Growth Forecasts for G7 and BRICS Countries in 2024
The IMF has released its economic growth forecasts for 2024. How do the G7 and BRICS countries compare?
-

 United States2 weeks ago
Ranked: The Largest U.S. Corporations by Number of Employees
We visualized the top U.S. companies by employees, revealing the massive scale of retailers like Walmart, Target, and Home Depot.
-

 Economy2 weeks ago
Where U.S. Inflation Hit the Hardest in March 2024
We visualized product categories that saw the highest % increase in price due to U.S. inflation as of March 2024.
-

 Economy1 month ago
G20 Inflation Rates: Feb 2024 vs COVID Peak
We visualize inflation rates across G20 countries as of Feb 2024, in the context of their COVID-19 pandemic peak.
-

 Economy1 month ago
Mapped: Unemployment Claims by State
This visual heatmap of unemployment claims by state highlights New York, California, and Alaska leading the country by a wide margin.
-

 Economy2 months ago
Confidence in the Global Economy, by Country
Will the global economy be stronger in 2024 than in 2023?


-

 Misc1 week ago
How Hard Is It to Get Into an Ivy League School?
-

 Technology2 weeks ago
Ranked: Semiconductor Companies by Industry Revenue Share
-

 Markets2 weeks ago
Ranked: The World’s Top Flight Routes, by Revenue
-

 Countries2 weeks ago
Population Projections: The World’s 6 Largest Countries in 2075
-

 Markets2 weeks ago
The Top 10 States by Real GDP Growth in 2023
-

 Demographics2 weeks ago
The Smallest Gender Wage Gaps in OECD Countries
-
Economy2 weeks ago
Where U.S. Inflation Hit the Hardest in March 2024
-

 Green2 weeks ago
Top Countries By Forest Growth Since 2001