Misc
9 Construction Projects That Broke the Bank
9 Construction Projects That Broke the Bank
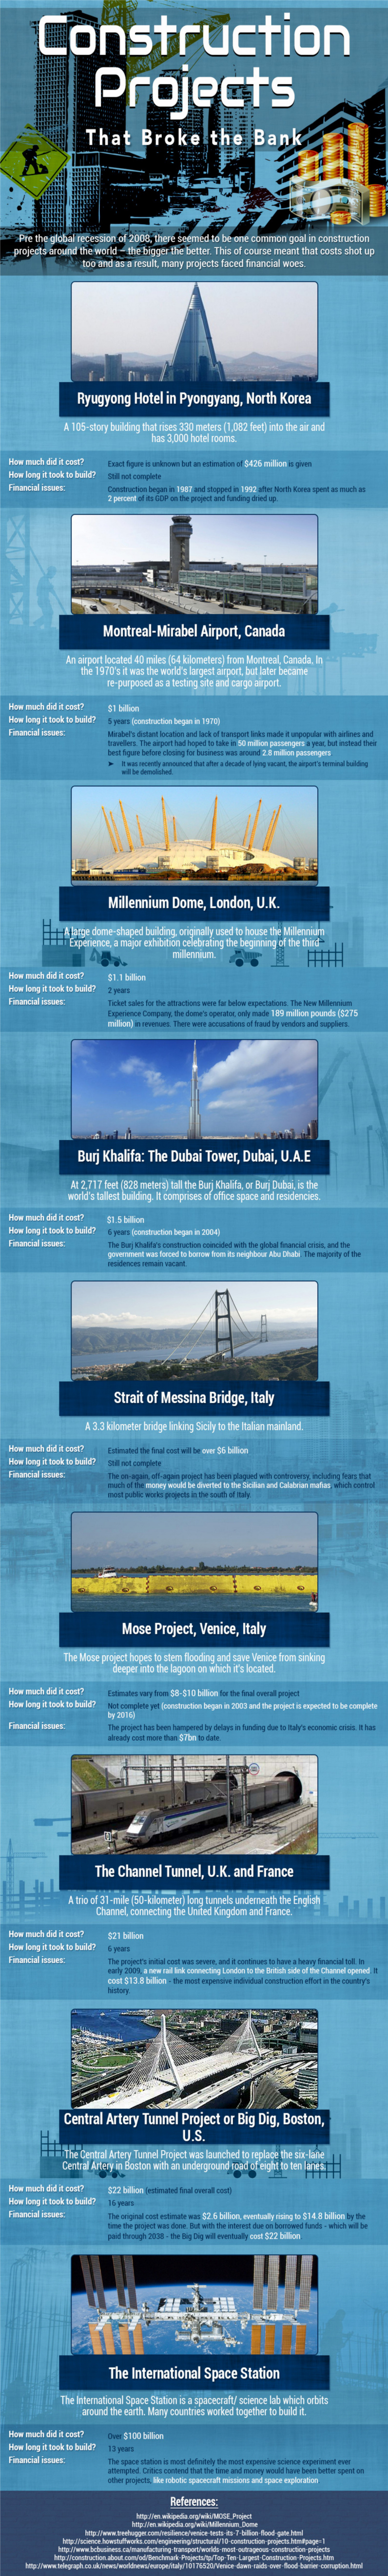
Large and sophisticated construction projects have a tendency to go over-budget and to sometimes stall indefinitely. However, there have been some that have disappointed more than others. Today’s infographic covers some of the most notorious construction projects that quadrupled in cost, become obsolete, or were downright botched.
For good reference before reading this list, it may be worth checking out this previous infographic: Top 10 Civil Engineering Projects of All-Time.
10 Construction Projects that Broke the Bank
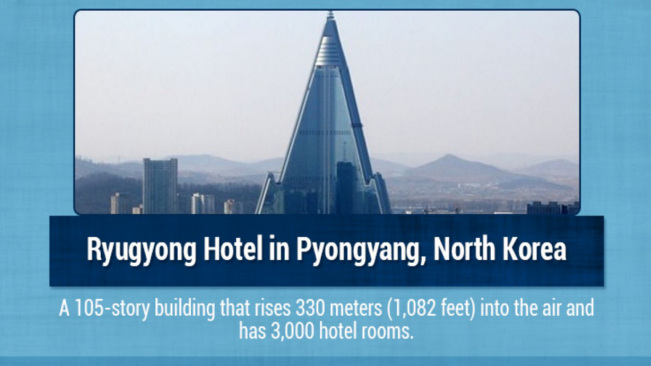
1. Ryugyong Hotel, Pyongyang (North Korea)
Construction began in 1987 and stopped in 1992 after North Korea spent as much as 2 percent of its GDP on the project and funding dried up.
2. Montreal-Mirabel Airport (Canada)
After $1 billion and five years of construction, this airport was hoped to take 50 million passengers a year. Instead it took 2.8 million, and ended up becoming a testing and cargo airport.
3. Millennium Dome, London (United Kingdom)
Costing $1.1 billion, ticket sales for attractions were well below expectations. The dome’s operator only made $275 million in revenues and were accused of fraud by vendors and suppliers.
4. Burj Khalifa, Dubai (United Arab Emirates)
The construction of the world’s tallest building coincided with the global financial crisis. Taking six years and costing $1.5 billion, Dubai had to borrow money from Abu Dhabi to complete it and the majority of residencies remain vacant.
5. Strait of Messina Bridge (Italy)
This 3.3 km bridge was expected to link Sicily to the Italian mainland. In 2013, it was discontinued because of lack of funds, and concerns that money would go to the Sicilian and Calabrian mafias.
6. Mose Project, Venice (Italy)
This project hopes to prevent Venice from sinking deeper into the lagoon on which the city is located. $7 billion has been spent to date, but it has been hampered with delays because of Italy’s economic condition.
7. The Channel Tunnel (UK and France)
50km long, underneath the English Channel, the Channel Tunnel continues to be a heavy financial toll. The rail link connecting London to the British side of the Channel opened, costing $13.8 billion, the most expensive individual construction effort in the country’s history.
8. The Big Dig, Boston (United States)
The original cost estimate for the Big Dig, an underground road of eight to ten lanes, was expected to be $2.6 billion. Now it is expected that with interest, the total cost will come to $22 billion.
9. The International Space Station (Space!)
Costing over $100 billion over 13 years, the space station is the most expensive science project ever attempted. Critics suggest that the money could have better spent on robotic spacecraft missions or space exploration.
Original graphic from: Gutter Masters


VC+
VC+: Get Our Key Takeaways From the IMF’s World Economic Outlook
A sneak preview of the exclusive VC+ Special Dispatch—your shortcut to understanding IMF’s World Economic Outlook report.

Have you read IMF’s latest World Economic Outlook yet? At a daunting 202 pages, we don’t blame you if it’s still on your to-do list.
But don’t worry, you don’t need to read the whole April release, because we’ve already done the hard work for you.
To save you time and effort, the Visual Capitalist team has compiled a visual analysis of everything you need to know from the report—and our upcoming VC+ Special Dispatch will be available exclusively to VC+ members on Thursday, April 25th.
If you’re not already subscribed to VC+, make sure you sign up now to receive the full analysis of the IMF report, and more (we release similar deep dives every week).
For now, here’s what VC+ members can expect to receive.
Your Shortcut to Understanding IMF’s World Economic Outlook
With long and short-term growth prospects declining for many countries around the world, this Special Dispatch offers a visual analysis of the key figures and takeaways from the IMF’s report including:
- The global decline in economic growth forecasts
- Real GDP growth and inflation forecasts for major nations in 2024
- When interest rate cuts will happen and interest rate forecasts
- How debt-to-GDP ratios have changed since 2000
- And much more!

Get the Full Breakdown in the Next VC+ Special Dispatch
VC+ members will receive the full Special Dispatch on Thursday, April 25th.
Make sure you join VC+ now to receive exclusive charts and the full analysis of key takeaways from IMF’s World Economic Outlook.
Don’t miss out. Become a VC+ member today.
What You Get When You Become a VC+ Member
VC+ is Visual Capitalist’s premium subscription. As a member, you’ll get the following:
- Special Dispatches: Deep dive visual briefings on crucial reports and global trends
- Markets This Month: A snappy summary of the state of the markets and what to look out for
- The Trendline: Weekly curation of the best visualizations from across the globe
- Global Forecast Series: Our flagship annual report that covers everything you need to know related to the economy, markets, geopolitics, and the latest tech trends
- VC+ Archive: Hundreds of previously released VC+ briefings and reports that you’ve been missing out on, all in one dedicated hub
You can get all of the above, and more, by joining VC+ today.

-

 Green1 week ago
Ranked: The Countries With the Most Air Pollution in 2023
-

 AI2 weeks ago
The Stock Performance of U.S. Chipmakers So Far in 2024
-

 Markets2 weeks ago
Charted: Big Four Market Share by S&P 500 Audits
-

 Real Estate2 weeks ago
Ranked: The Most Valuable Housing Markets in America
-

 Money2 weeks ago
Which States Have the Highest Minimum Wage in America?
-

 AI2 weeks ago
Ranked: Semiconductor Companies by Industry Revenue Share
-

 Travel2 weeks ago
Ranked: The World’s Top Flight Routes, by Revenue
-

 Countries2 weeks ago
Population Projections: The World’s 6 Largest Countries in 2075