Green
The World’s Water Access in One Visualization
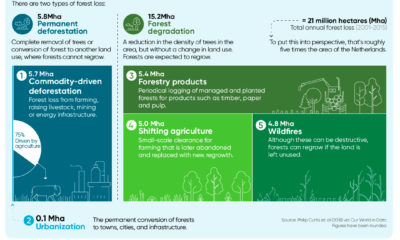
View a high resolution version of this graphic.
The World’s Water Access in One Visualization
View the high resolution version of today’s graphic by clicking here.
Water is the world’s most vital resource. Beyond its basic functions of sustaining life, it’s also a precious commodity – one that billions of people in the world have trouble accessing.
Today’s infographic is from Raconteur, and it puts the global issue of water access into staggering perspective. It’s a two-fold problem: safe drinking water is hard to come by, while basic access to sanitation is less common than you’d expect.
Diving into Drinking Water
It’s easy to take water for granted when it comes out of every tap in developed economies, but the stark reality is that 2.1 billion people worldwide can’t get safe water this way.
Many people in the world spend hours waiting in long lines, often multiple times a day, for community-shared water, or, they have to travel to distant sources just to collect it.
World regions are categorized according to five classifications for drinking water access.
Here’s a breakdown of how each region fares.
| Region | Safely Managed | Basic | Limited | Unimproved | Surface Water |
|---|---|---|---|---|---|
| North America | 99% | - | - | 1% | - |
| Western Europe | 96% | 3% | - | 1% | - |
| Eastern Europe and Central Asia | 84% | 11% | 2% | 2% | 1% |
| Middle East and North Africa | 77% | 16% | 4% | 2% | 1% |
| Latin America and Caribbean | 65% | 31% | 1% | 2% | 1% |
| Eastern and Southern Africa | 26% | 28% | 18% | 16% | 12% |
| West and Central Africa | 23% | 40% | 10% | 20% | 7% |
| East Asia and Pacific | - | 94% | 1% | 4% | 1% |
| South Asia | - | 88% | 4% | 7% | 1% |
The water crisis in Flint, Michigan is a dire exception to the safely managed water rule in North America. After a change in river source in 2014, insufficient water treatment resulted in lead from pipes leaching into the drinking water, affecting over 100,000 residents.
The Struggle of Sanitation
The invention of the toilet in 1875 is credited with saving one billion lives to date. Yet, poor water hygiene and its associated diseases claim the lives of roughly one million people annually.
This is because roughly 4.5 billion people still don’t have access to a toilet, with the problem being particularly acute on the African continent. More than half of the population in Eritrea (76%), Niger (71%), Chad (68%) and South Sudan (61%), for example, do not have any access to even basic sanitation.
Every Drop of Water Counts
According to the World Economic Forum, water has been a top-five global risk for the past seven years.
From an economic perspective, it’s easy to see why:
- An estimated $260 billion is lost globally each year from the lack of basic water and sanitation.
- Almost $18.5 billion in benefits can come from universal access to basic water and sanitation.
Securing water access has profound consequences. For every $1 invested in water and sanitation, there’s a $4 return from lower health costs, higher productivity, and fewer preventable deaths.
Fortunately, progress is being made on the global scale. Between 2001 and 2015, there’s been a 9% improvement in safe drinking water, while safely managed sanitation has risen by 10%.


Green
The Carbon Footprint of Major Travel Methods
Going on a cruise ship and flying domestically are the most carbon-intensive travel methods.


The Carbon Footprint of Major Travel Methods
This was originally posted on our Voronoi app. Download the app for free on iOS or Android and discover incredible data-driven charts from a variety of trusted sources.
Did you know that transport accounts for nearly one-quarter of global energy-related carbon dioxide (CO₂) emissions?
This graphic illustrates the carbon footprints of major travel methods measured in grams of carbon dioxide equivalent (CO₂e) emitted per person to travel one kilometer. This includes both CO₂ and other greenhouse gases.
Data is sourced from Our World in Data, the UK Government’s Department for Energy Security and Net Zero, and The International Council on Clean Transportation, as of December 2022.
These figures should be interpreted as approximations, rather than exact numbers. There are many variables at play that determine the actual carbon footprint in any individual case, including vehicle type or model, occupancy, energy mix, and even weather.
Cruise Ships are the Most Carbon-Intensive Travel Method
According to these estimates, taking a cruise ship, flying domestically, and driving alone are some of the most carbon-intensive travel methods.
Cruise ships typically use heavy fuel oil, which is high in carbon content. The average cruise ship weighs between 70,000 to 180,000 metric tons, meaning they require large engines to get moving.
These massive vessels must also generate power for onboard amenities such as lighting, air conditioning, and entertainment systems.
Short-haul flights are also considered carbon-intensive due to the significant amount of fuel consumed during initial takeoff and climbing altitude, relative to a lower amount of cruising.
| Transportation method | CO₂ equivalent emissions per passenger km |
|---|---|
| Cruise Ship | 250 |
| Short-haul flight (i.e. within a U.S. state or European country) | 246 |
| Diesel car | 171 |
| Gas car | 170 |
| Medium-haul flight (i.e. international travel within Europe, or between U.S. states) | 151 |
| Long-haul flight (over 3,700 km, about the distance from LA to NY) | 147 |
| Motorbike | 113 |
| Bus (average) | 96 |
| Plug-in hybrid | 68 |
| Electric car | 47 |
| National rail | 35 |
| Tram | 28 |
| London Underground | 27 |
| Ferry (foot passenger) | 19 |
| Eurostar (International rail) | 4.5 |
Are EVs Greener?
Many experts agree that EVs produce a lower carbon footprint over time versus traditional internal combustion engine (ICE) vehicles.
However, the batteries in electric vehicles charge on the power that comes straight off the electrical grid—which in many places may be powered by fossil fuels. For that reason, the carbon footprint of an EV will depend largely on the blend of electricity sources used for charging.
There are also questions about how energy-intensive it is to build EVs compared to a comparable ICE vehicle.

-

 Debt1 week ago
How Debt-to-GDP Ratios Have Changed Since 2000
-

 Markets2 weeks ago
Ranked: The World’s Top Flight Routes, by Revenue
-

 Countries2 weeks ago
Population Projections: The World’s 6 Largest Countries in 2075
-

 Markets2 weeks ago
The Top 10 States by Real GDP Growth in 2023
-

 Demographics2 weeks ago
The Smallest Gender Wage Gaps in OECD Countries
-

 United States2 weeks ago
Where U.S. Inflation Hit the Hardest in March 2024
-

 Green2 weeks ago
Top Countries By Forest Growth Since 2001
-

 United States2 weeks ago
Ranked: The Largest U.S. Corporations by Number of Employees