Investor Education
Human Insight, Computer Power: What is Quantamental Investing?

What is Quantamental Investing?
The world is awash in data like never before. From a person’s morning Uber ride and favorite coffee spot, to the emails sent from their office—all these activities create massive amounts of data, but also behavioral and investment insights.
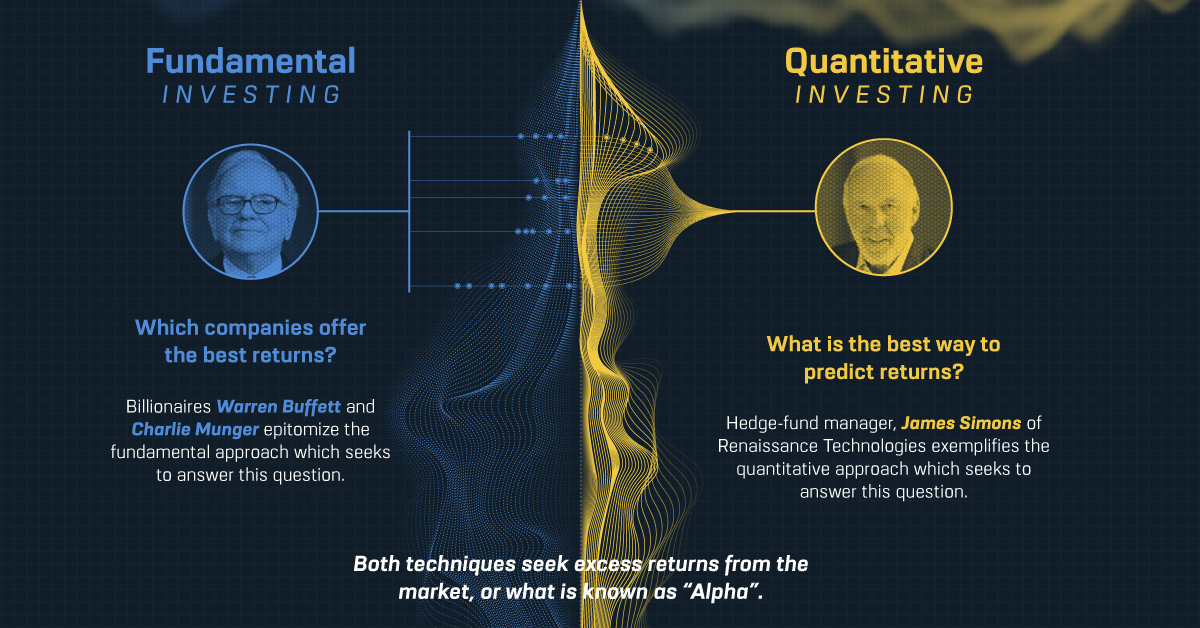
Warren Buffett’s investment style exemplifies the fundamental approach: “Which companies offer the best returns?”
On the other hand, hedge fund manager James Simons of Renaissance Technologies is a notable example of the quantitative approach: “What is the best way to predict returns?”
Both techniques have one thing in common—they seek excess return from the marketplace, or what is known as “Alpha”.
Quantamental: Combining Quantitative & Fundamental
Today’s infographic from GoldSpot Discoveries outlines quantamental investing as the blending of these two styles, human insight with computer power.
Despite both methods seeking excess returns in the market, there are some key differences:
| Quantitative Analysis | Fundamental Analysis |
|
|
| Cons | Cons |
|
|
| Pro | Pro |
|
|
The arrival of advanced sensor technology and computer processing power is creating huge opportunities for capturing the complexity of human activity on a larger scale.
Could these two distinct methods be fused together?
A New Frontier for Data: Combining Man and Machine
On a larger scale, tracking and storing data can reveal economic patterns over long periods of time. For example, satellite images of a mall’s parking lot can determine the mall’s sales volume. In the finance world, software can track sentiment in earnings call transcripts, and detect word patterns of executives.
The applications of sensor technology stretch across various cases, and could improve overall performance in different industries.
Case #1: Sabermetrics
Picking a winning baseball team is a lot like investing: with limited capital, one needs to optimize player selection and performance to beat the competition. That is why the Major League Baseball Association installed StatScan in 30 ballparks for 3 seasons (2015-2017).
These radar and camera systems captured the raw skills of players in ways that were previously available to or only understood by the baseball scouts.
Scouts are the stock pickers of the baseball. They know the ins and outs of a potential major league player, and consider health, family history, body mechanics and even personalities.
Team managers can use a scout’s insight, against the vast amounts of data collected during a baseball season, to uncover the exact metrics to predict the success of the next great home run or strike-out king.
Case #2: Mineral Exploration
Resource companies spend huge amounts of money on exploration to collect data. However, the volume of data generated is too much for one geologist, or even a team to sift through in a reasonable time.
Machine learning in mineral exploration can take in training data to help identify prospective land for a mineral deposit.
Computer Power with a Human Touch
Quantamental investing seeks to understand the depth and the breadth of the investment world. The goal is to produce superior returns in the marketplace by answering two questions.
- What are the best metrics for predicting success?
- Which are the companies performing the best on these metrics?
Quantamental investing harnesses the raw power and scale of data, coupled with human insight — increasing market returns by finding the next great investment.
Investor Education
How MSCI Builds Thematic Indexes: A Step-by-Step Guide
From developing an index objective to choosing relevant stocks, this graphic breaks down how MSCI builds thematic indexes using examples.
How MSCI Builds Thematic Indexes: A Step-by-Step Guide
Have you ever wondered how MSCI builds its thematic indexes?
To capture long-term, structural trends that could drive business performance in the future, the company follows a systematic approach. This graphic from MSCI breaks down each step in the process used to create its thematic indexes.
Step 1: Develop an Index Objective
MSCI first builds a broad statement of what the theme aims to capture based on extensive research and insights from industry experts.
Steps 2 and 3: List Sub-Themes, Generate Keyword List
Together with experts, MSCI creates a list of sub-themes or “seedwords” to identify aligned business activities.
The team then assembles a collection of suitable documents describing the theme. Natural language processing efficiently analyzes word frequency and relevance to generate a more detailed set of keywords contextually similar to the seedwords.
Step 4: Find Relevant Companies
By analyzing financial reports, MSCI picks companies relevant to the theme using two methods:
- Direct approach: Revenue from a company’s business segment is considered 100% relevant if the segment name matches a theme keyword. Standard Industrial Classification (SIC) codes from these directly-matched segments make up the eligible SIC code list used in the indirect approach.
- Indirect approach: If a segment name doesn’t match theme keywords, MSCI will:
- Analyze the density of theme keywords mentioned in the company’s description. A minimum of two unique keywords is required.
- The keyword density determines a “discount factor” to reflect lower certainty in theme alignment.
- Revenue from business segments with an eligible SIC code, regardless of how they are named, is scaled down by the discount factor.
The total percentage of revenue applicable to the theme from both approaches determines a company’s relevance score.
Step 5: Select the Stocks
Finally, MSCI narrows down the stocks that will be included:
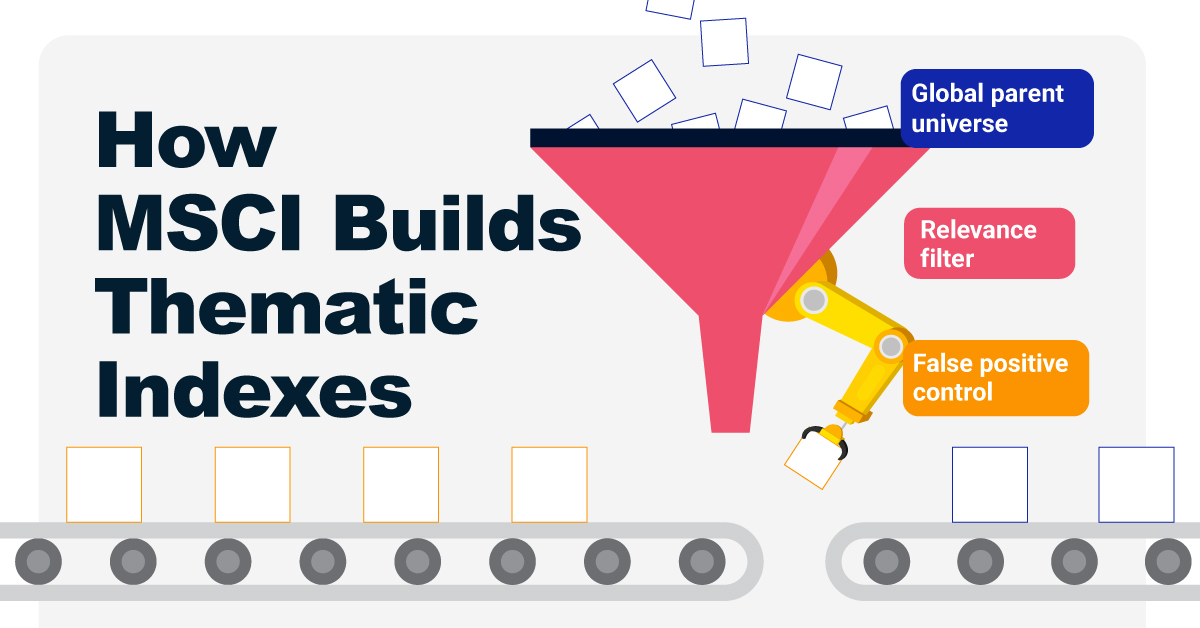
- Global parent universe: The ACWI Investable Market Index (IMI) is the starting point for standard thematic indexes.
- Relevance filter: The universe is filtered for companies with a relevance score of at least 25%.
- False positive control: Eligible companies that are mapped to un-related GICS sub-industries are removed.
Companies with higher relevance scores and market caps have a higher weighting in the index, with the maximum weighting for any one issuer capped at 5%. The final selected stocks span various sectors.
MSCI Thematic Indexes: Regularly Updated and Rules-Based
Once an index is built, it is reviewed semi-annually and updated based on:
- Changes to the parent index
- Changes at individual companies
- Theme developments based on expert input
Theme keywords are reviewed yearly in May. Overall, MSCI’s thematic index construction process is objective, scalable, and flexible. The process can be customized based on the theme(s) you want to capture.

Learn more about MSCI’s thematic indexes.

-
 Investor Education6 months ago
The 20 Most Common Investing Mistakes, in One Chart
Here are the most common investing mistakes to avoid, from emotionally-driven investing to paying too much in fees.
-
 Stocks10 months ago
Visualizing BlackRock’s Top Equity Holdings
BlackRock is the world’s largest asset manager, with over $9 trillion in holdings. Here are the company’s top equity holdings.
-
 Investor Education11 months ago
10-Year Annualized Forecasts for Major Asset Classes
This infographic visualizes 10-year annualized forecasts for both equities and fixed income using data from Vanguard.
-

 Investor Education1 year ago
Visualizing 90 Years of Stock and Bond Portfolio Performance
How have investment returns for different portfolio allocations of stocks and bonds compared over the last 90 years?
-
 Debt2 years ago
Countries with the Highest Default Risk in 2022
In this infographic, we examine new data that ranks the top 25 countries by their default risk.
-
 Markets2 years ago
The Best Months for Stock Market Gains
This infographic analyzes over 30 years of stock market performance to identify the best and worst months for gains.
-

 Lithium6 days ago
Ranked: The Top 10 EV Battery Manufacturers in 2023
-

 Green2 weeks ago
Top Countries By Forest Growth Since 2001
-

 United States2 weeks ago
Ranked: The Largest U.S. Corporations by Number of Employees
-

 Maps2 weeks ago
The Largest Earthquakes in the New York Area (1970-2024)
-

 Green2 weeks ago
Ranked: The Countries With the Most Air Pollution in 2023
-

 Green2 weeks ago
Ranking the Top 15 Countries by Carbon Tax Revenue
-

 Markets2 weeks ago
U.S. Debt Interest Payments Reach $1 Trillion
-

 Mining2 weeks ago
Gold vs. S&P 500: Which Has Grown More Over Five Years?

