Money
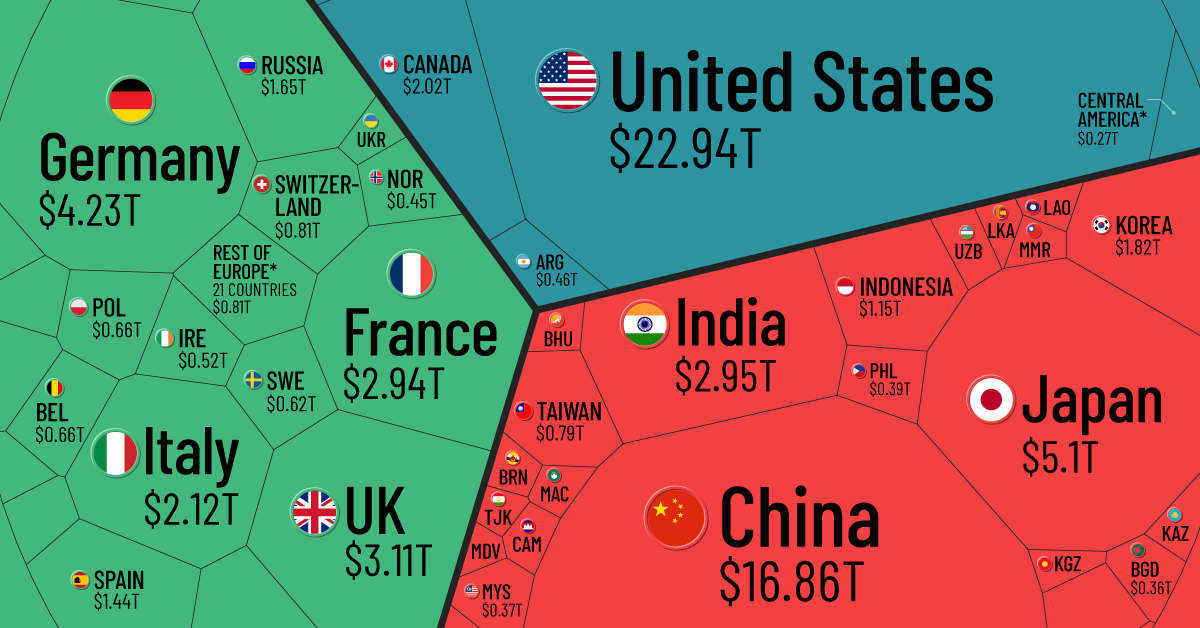
Visualizing the $94 Trillion World Economy in One Chart
Check out the latest 2023 update of the world economy in one chart.

View the expanded version of this infographic to see all countries.
 Can I share this graphic?
 When do I need a license?
 Interested in this piece?
The $94 Trillion World Economy in One Chart
Check out the latest 2023 update of the world economy in one chart.
Just four countries—the U.S., China, Japan, and Germany—make up over half of the world’s economic output by gross domestic product (GDP) in nominal terms. In fact, the GDP of the U.S. alone is greater than the combined GDP of 170 countries.
How do the different economies of the world compare? In this visualization we look at GDP by country in 2021, using data and estimates from the International Monetary Fund (IMF).
An Overview of GDP
GDP serves as a broad indicator for a country’s economic output. It measures the total market value of final goods and services produced in a country in a specific timeframe, such as a quarter or year. In addition, GDP also takes into consideration the output of services provided by the government, such as money spent on defense, healthcare, or education.
Generally speaking, when GDP is increasing in a country, it is a sign of greater economic activity that benefits workers and businesses (while the reverse is true for a decline).
The World Economy: Top 50 Countries
Who are the biggest contributors to the global economy? Here is the ranking of the 50 largest countries by GDP in 2021:
| Rank | Country | GDP ($T) | % of Global GDP |
|---|---|---|---|
| 1 | 🇺🇸 U.S. | $22.9 | 24.4% |
| 2 | 🇨🇳 China | $16.9 | 17.9% |
| 3 | 🇯🇵 Japan | $5.1 | 5.4% |
| 4 | 🇩🇪 Germany | $4.2 | 4.5% |
| 5 | 🇬🇧 UK | $3.1 | 3.3% |
| 6 | 🇮🇳 India | $2.9 | 3.1% |
| 7 | 🇫🇷 France | $2.9 | 3.1% |
| 8 | 🇮🇹 Italy | $2.1 | 2.3% |
| 9 | 🇨🇦 Canada | $2.0 | 2.1% |
| 10 | 🇰🇷 Korea | $1.8 | 1.9% |
| 11 | 🇷🇺 Russia | $1.6 | 1.7% |
| 12 | 🇧🇷 Brazil | $1.6 | 1.7% |
| 13 | 🇦🇺 Australia | $1.6 | 1.7% |
| 14 | 🇪🇸 Spain | $1.4 | 1.5% |
| 15 | 🇲🇽 Mexico | $1.3 | 1.4% |
| 16 | 🇮🇩 Indonesia | $1.2 | 1.2% |
| 17 | 🇮🇷 Iran | $1.1 | 1.1% |
| 18 | 🇳🇱 Netherlands | $1.0 | 1.1% |
| 19 | 🇸🇦 Saudi Arabia | $0.8 | 0.9% |
| 20 | 🇨🇭 Switzerland | $0.8 | 0.9% |
| 21 | 🇹🇷 Turkey | $0.8 | 0.8% |
| 22 | 🇹🇼 Taiwan | $0.8 | 0.8% |
| 23 | 🇵🇱 Poland | $0.7 | 0.7% |
| 24 | 🇸🇪 Sweden | $0.6 | 0.7% |
| 25 | 🇧🇪 Belgium | $0.6 | 0.6% |
| 26 | 🇹🇭 Thailand | $0.5 | 0.6% |
| 27 | 🇮🇪 Ireland | $0.5 | 0.5% |
| 28 | 🇦🇹 Austria | $0.5 | 0.5% |
| 29 | 🇳🇬 Nigeria | $0.5 | 0.5% |
| 30 | 🇮🇱 Israel | $0.5 | 0.5% |
| 31 | 🇦🇷 Argentina | $0.5 | 0.5% |
| 32 | 🇳🇴 Norway | $0.4 | 0.5% |
| 33 | 🇿🇦 South Africa | $0.4 | 0.4% |
| 34 | 🇦🇪 UAE | $0.4 | 0.4% |
| 35 | 🇩🇰 Denmark | $0.4 | 0.4% |
| 36 | 🇪🇬 Egypt | $0.4 | 0.4% |
| 37 | 🇵🇭 Philippines | $0.4 | 0.4% |
| 38 | 🇸🇬 Singapore | $0.4 | 0.4% |
| 39 | 🇲🇾 Malaysia | $0.4 | 0.4% |
| 40 | 🇭🇰 Hong Kong SAR | $0.4 | 0.4% |
| 41 | 🇻🇳 Vietnam | $0.4 | 0.4% |
| 42 | 🇧🇩 Bangladesh | $0.4 | 0.4% |
| 43 | 🇨🇱 Chile | $0.3 | 0.4% |
| 44 | 🇨🇴 Colombia | $0.3 | 0.3% |
| 45 | 🇫🇮 Finland | $0.3 | 0.3% |
| 46 | 🇷🇴 Romania | $0.3 | 0.3% |
| 47 | 🇨🇿 Czech Republic | $0.3 | 0.3% |
| 48 | 🇵🇹 Portugal | $0.3 | 0.3% |
| 49 | 🇵🇰 Pakistan | $0.3* | 0.3% |
| 50 | 🇳🇿 New Zealand | $0.2 | 0.3% |
*2020 GDP (latest available) used where IMF estimates for 2021 were unavailable.
At $22.9 trillion, the U.S. GDP accounts for roughly 25% of the global economy, a share that has actually changed significantly over the last 60 years. The finance, insurance, and real estate ($4.7 trillion) industries add the most to the country’s economy, followed by professional and business services ($2.7 trillion) and government ($2.6 trillion).
China’s economy is second in nominal terms, hovering at near $17 trillion in GDP. It remains the largest manufacturer worldwide based on output with extensive production of steel, electronics, and robotics, among others.
The largest economy in Europe is Germany, which exports roughly 20% of the world’s motor vehicles. In 2019, overall trade equaled nearly 90% of the country’s GDP.
The World Economy: 50 Smallest Countries
On the other end of the spectrum are the world’s smallest economies by GDP, primarily developing and island nations.
With a GDP of $70 million, Tuvalu is the smallest economy in the world. Situated between Hawaii and Australia, the largest industry of this volcanic archipelago relies on territorial fishing rights.
In addition, the country earns significant revenue from its “.tv” web domain. Between 2011 and 2019, it earned $5 million annually from companies—including Amazon-owned Twitch to license the Twitch.tv domain name—equivalent to roughly 7% of the country’s GDP.
| Countries | Region | GDP (B) |
|---|---|---|
| 🇹🇻 Tuvalu | Oceania | $0.07 |
| 🇳🇷 Nauru | Oceania | $0.1 |
| 🇵🇼 Palau | Oceania | $0.2 |
| 🇰🇮 Kiribati | Oceania | $0.2 |
| 🇲🇭 Marshall Islands | Oceania | $0.2 |
| 🇫🇲 Micronesia | Oceania | $0.4 |
| 🇨🇰 Cook Islands | Oceania | $0.4* |
| 🇹🇴 Tonga | Oceania | $0.5 |
| 🇸🇹 São Tomé and Príncipe | Africa | $0.5 |
| 🇩🇲 Dominica | Caribbean | $0.6 |
| 🇻🇨 St. Vincent and the Grenadines | Caribbean | $0.8 |
| 🇼🇸 Samoa | Oceania | $0.8 |
| 🇰🇳 St. Kitts and Nevis | Caribbean | $1.0 |
| 🇻🇺 Vanuatu | Oceania | $1.0 |
| 🇬🇩 Grenada | Caribbean | $1.1 |
| 🇰🇲 Comoros | Africa | $1.3 |
| 🇸🇨 Seychelles | Africa | $1.3 |
| 🇦🇬 Antigua and Barbuda | Caribbean | $1.4 |
| 🇬🇼 Guinea-Bissau | Africa | $1.6 |
| 🇸🇧 Solomon Islands | Oceania | $1.7 |
| 🇹🇱 Timor-Leste | Asia | $1.7 |
| 🇱🇨 St. Lucia | Caribbean | $1.7 |
| 🇸🇲 San Marino | Europe | $1.7 |
| 🇨🇻 Cabo Verde | Africa | $1.9 |
| 🇧🇿 Belize | Central America | $1.9 |
| 🇬🇲 Gambia | Africa | $2.0 |
| 🇪🇷 Eritrea | Africa | $2.3 |
| 🇱🇸 Lesotho | Africa | $2.5 |
| 🇧🇹 Bhutan | Asia | $2.5 |
| 🇨🇫 Central African Republic | Africa | $2.6 |
| 🇸🇷 Suriname | South America | $2.8 |
| 🇦🇼 Aruba | Caribbean | $2.9 |
| 🇧🇮 Burundi | Africa | $3.2 |
| 🇦🇩 Andorra | Europe | $3.2 |
| 🇸🇸 South Sudan | Africa | $3.3 |
| 🇱🇷 Liberia | Africa | $3.4 |
| 🇩🇯 Djibouti | Africa | $3.7 |
| 🇸🇱 Sierra Leone | Africa | $4.4 |
| 🇸🇿 Eswatini | Africa | $4.5 |
| 🇲🇻 Maldives | Asia | $4.6 |
| 🇫🇯 Fiji | Oceania | $4.6 |
| 🇧🇧 Barbados | Caribbean | $4.7 |
| 🇸🇴 Somalia | Africa | $5.4 |
| 🇲🇪 Montenegro | Europe | $5.5 |
| 🇱🇮 Liechtenstein | Europe | $6.8* |
| 🇬🇾 Guyana | South America | $7.4 |
| 🇲🇨 Monaco | Europe | $7.4* |
| 🇹🇯 Tajikistan | Asia | $8.1 |
| 🇰🇬 Kyrgyz Republic | Asia | $8.2 |
| 🇹🇬 Togo | Africa | $8.5 |
*2019 GDP (latest available) used where IMF estimates for 2021 were unavailable.
Like Tuvalu, many of the world’s smallest economies are in Oceania, including Nauru, Palau, and Kiribati. Additionally, several countries above rely on the tourism industry for over one-third of their employment.
The Fastest Growing Economies in the World in 2021
With 123% projected GDP growth, Libya’s economy is estimated to have the sharpest rise.
Oil is propelling its growth, with 1.2 million barrels being pumped in the country daily. Along with this, exports and a depressed currency are among the primary factors behind its recovery.
| Rank | Country | Region | 2021 Real GDP Growth (Annual % Change) |
|---|---|---|---|
| 1 | 🇱🇾 Libya | Africa | 123.2% |
| 2 | 🇬🇾 Guyana | South America | 20.4% |
| 3 | 🇲🇴 Macao | Asia | 20.4% |
| 4 | 🇲🇻 Maldives | Asia | 18.9% |
| 5 | 🇮🇪 Ireland | Europe | 13.0% |
| 6 | 🇦🇼 Aruba | Caribbean | 12.8% |
| 7 | 🇵🇦 Panama | Central America | 12.0% |
| 8 | 🇨🇱 Chile | South America | 11.0% |
| 9 | 🇵🇪 Peru | South America | 10.0% |
| 10 | 🇩🇴 Dominican Republic | Caribbean | 9.5% |
Ireland’s economy, with a projected 13% real GDP growth, is being supported by the largest multinational corporations in the world. Facebook, TikTok, Google, Apple, and Pfizer all have their European headquarters in the country, which has a 12.5% corporate tax rate—or about half the global average. But these rates are set to change soon, as Ireland joined the OECD 15% minimum corporate tax rate agreement which was finalized in October 2021.
Macao’s economy bounced back after COVID-19 restrictions began to lift, but more storm clouds are on the horizon for the Chinese district. The CCP’s anti-corruption campaign and recent arrests could signal a more strained relationship between Mainland China and the world’s largest gambling hub.
Looking Ahead at the World’s GDP
The global GDP figure of $94 trillion may seem massive to us today, but such a total might seem much more modest in the future.
In 1970, the world economy was only about $3 trillion in GDP—or 30 times smaller than it is today. Over the next thirty years, the global economy is expected to more or less double again. By 2050, global GDP could total close to $180 trillion.
Correction: In earlier versions of this graphic, countries such as Vietnam and Pakistan were inadvertently not included in the visualization. They have now been added. In cases where the IMF has no data for 2021 (specifically Pakistan, Syria, Afghanistan, and Lebanon), the latest available data is used.


Money
Charted: Which City Has the Most Billionaires in 2024?
Just two countries account for half of the top 20 cities with the most billionaires. And the majority of the other half are found in Asia.


Charted: Which Country Has the Most Billionaires in 2024?
This was originally posted on our Voronoi app. Download the app for free on iOS or Android and discover incredible data-driven charts from a variety of trusted sources.
Some cities seem to attract the rich. Take New York City for example, which has 340,000 high-net-worth residents with investable assets of more than $1 million.
But there’s a vast difference between being a millionaire and a billionaire. So where do the richest of them all live?
Using data from the Hurun Global Rich List 2024, we rank the top 20 cities with the highest number of billionaires in 2024.
A caveat to these rich lists: sources often vary on figures and exact rankings. For example, in last year’s reports, Forbes had New York as the city with the most billionaires, while the Hurun Global Rich List placed Beijing at the top spot.
Ranked: Top 20 Cities with the Most Billionaires in 2024
The Chinese economy’s doldrums over the course of the past year have affected its ultra-wealthy residents in key cities.
Beijing, the city with the most billionaires in 2023, has not only ceded its spot to New York, but has dropped to #4, overtaken by London and Mumbai.
| Rank | City | Billionaires | Rank Change YoY |
|---|---|---|---|
| 1 | 🇺🇸 New York | 119 | +1 |
| 2 | 🇬🇧 London | 97 | +3 |
| 3 | 🇮🇳 Mumbai | 92 | +4 |
| 4 | 🇨🇳 Beijing | 91 | -3 |
| 5 | 🇨🇳 Shanghai | 87 | -2 |
| 6 | 🇨🇳 Shenzhen | 84 | -2 |
| 7 | 🇭🇰 Hong Kong | 65 | -1 |
| 8 | 🇷🇺 Moscow | 59 | No Change |
| 9 | 🇮🇳 New Delhi | 57 | +6 |
| 10 | 🇺🇸 San Francisco | 52 | No Change |
| 11 | 🇹🇭 Bangkok | 49 | +2 |
| 12 | 🇹🇼 Taipei | 45 | +2 |
| 13 | 🇫🇷 Paris | 44 | -2 |
| 14 | 🇨🇳 Hangzhou | 43 | -5 |
| 15 | 🇸🇬 Singapore | 42 | New to Top 20 |
| 16 | 🇨🇳 Guangzhou | 39 | -4 |
| 17T | 🇮🇩 Jakarta | 37 | +1 |
| 17T | 🇧🇷 Sao Paulo | 37 | No Change |
| 19T | 🇺🇸 Los Angeles | 31 | No Change |
| 19T | 🇰🇷 Seoul | 31 | -3 |
In fact all Chinese cities on the top 20 list have lost billionaires between 2023–24. Consequently, they’ve all lost ranking spots as well, with Hangzhou seeing the biggest slide (-5) in the top 20.
Where China lost, all other Asian cities—except Seoul—in the top 20 have gained ranks. Indian cities lead the way, with New Delhi (+6) and Mumbai (+3) having climbed the most.
At a country level, China and the U.S combine to make up half of the cities in the top 20. They are also home to about half of the world’s 3,200 billionaire population.
In other news of note: Hurun officially counts Taylor Swift as a billionaire, estimating her net worth at $1.2 billion.

-

 Education1 week ago
How Hard Is It to Get Into an Ivy League School?
-

 Technology2 weeks ago
Ranked: Semiconductor Companies by Industry Revenue Share
-

 Markets2 weeks ago
Ranked: The World’s Top Flight Routes, by Revenue
-

 Demographics2 weeks ago
Population Projections: The World’s 6 Largest Countries in 2075
-

 Markets2 weeks ago
The Top 10 States by Real GDP Growth in 2023
-

 Demographics2 weeks ago
The Smallest Gender Wage Gaps in OECD Countries
-

 Economy2 weeks ago
Where U.S. Inflation Hit the Hardest in March 2024
-

 Green2 weeks ago
Top Countries By Forest Growth Since 2001