Datastream
The U.S. Share of the Global Economy Over Time

The Briefing
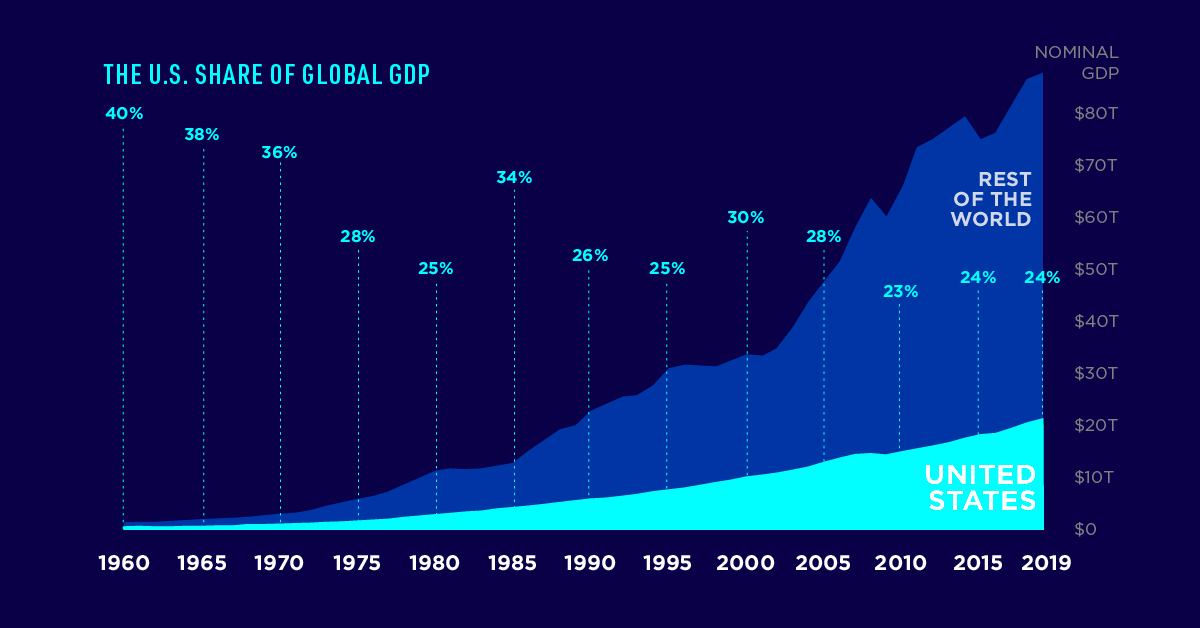
- The U.S. share of the global economy has nearly halved since 1960
- America’s nominal GDP in current U.S. dollars is $21.4 trillion, or about 24% of the share of the global economy
The World’s Largest Economy
The U.S. is the world’s largest economy by nominal GDP, and its influence on the global economy is quite remarkable.
As of 2019, the U.S. made up almost a quarter of the global economy. But how has America’s share of the economic pie changed over time?
The U.S. Share of the Global Economy Over Time
While the U.S. economy has grown quickly over time, the global economy has grown quicker.
Since peaking at 40% in 1960, the U.S. share of the world economy has been cut almost in half, despite a rising national GDP and being the birthplace of some of the biggest companies on the planet.
| Year | Global GDP | U.S. GDP | U.S. Share of Global Economy |
|---|---|---|---|
| 1960 | $1.37T | $0.53T | 40% |
| 1965 | $1.97T | $0.74T | 38% |
| 1970 | $2.96T | $1.07T | 36% |
| 1975 | $5.92T | $1.69T | 28% |
| 1980 | $11.23T | $2.86T | 25% |
| 1985 | $12.79T | $4.34T | 34% |
| 1990 | $22.63T | $5.96T | 26% |
| 1995 | $30.89T | $7.64T | 25% |
| 2000 | $33.62T | $10.25T | 30% |
| 2005 | $47.53T | $13.04T | 28% |
| 2010 | $66.13T | $14.99T | 23% |
| 2015 | $75.22T | $18.23T | 24% |
| 2019 | $87.80T | $21.43T | 24% |
The decline of America’s contribution to global GDP has been slow and uneven, with crests and troughs along the way.
Between 1965 and 1980, the country’s share fell by 13 percentage points, mainly due to stagflation of the 1970s. This decline was followed by Reaganomics and a period of strong recovery, which helped propel the U.S. share of the global economy back up to 34% by 1985.
The whipsawing would continue. Between 1985 and 1995, the U.S share fell by another 11 percentage points, only to bounce back to a local peak of 30% by the year 2000.
Downhill From Here?
Since the beginning of the 21st century, growth in many developing markets has continued at a rapid pace—and the U.S. share of the global economy has decreased as a result.
Until 2005, the U.S. still accounted for 28% of global GDP, but the Global Financial Crisis left a big dent, and its share fell to 23% by 2010. It has since remained relatively stable at 24%.
It’s important to put this decline into perspective. For instance, China’s share of the global economy grew from 4% in 1960 to 16.3% in 2019. Over that same time period, other countries like South Korea, Brazil, Mexico, Indonesia, and India also saw their emergence on the economic world stage, as well.
What the Future Holds
The COVID-19 pandemic has changed the course of the global economy, with most countries experiencing a recession in 2020. America’s economic position will depend on how quickly it can recover compared to the rest of the world.
Where does this data come from?
Source: The World Bank
Details: Data is in current U.S. dollars. Dollar figures for GDP are converted from domestic currencies using single year official exchange rates.


Datastream
Can You Calculate Your Daily Carbon Footprint?
Discover how the average person’s carbon footprint impacts the environment and learn how carbon credits can offset your carbon footprint.


The Briefing
- A person’s carbon footprint is substantial, with activities such as food consumption creating as much as 4,500 g of CO₂ emissions daily.
- By purchasing carbon credits from Carbon Streaming Corporation, you can offset your own emissions and fund positive climate action.
Your Everyday Carbon Footprint
While many large businesses and countries have committed to net-zero goals, it is essential to acknowledge that your everyday activities also contribute to global emissions.
In this graphic, sponsored by Carbon Streaming Corporation, we will explore how the choices we make and the products we use have a profound impact on our carbon footprint.
Carbon Emissions by Activity
Here are some of the daily activities and products of the average person and their carbon footprint, according to Clever Carbon.
| Household Activities & Products | CO2 Emissions (g) |
|---|---|
| 💡 Standard Light Bulb (100 watts, four hours) | 172 g |
| 📱 Mobile Phone Use (195 minutes per day)* | 189 g |
| 👕 Washing Machine (0.63 kWh) | 275 g |
| 🔥 Electric Oven (1.56 kWh) | 675 g |
| ♨️ Tumble Dryer (2.5 kWh) | 1,000 g |
| 🧻 Toilet Roll (2 ply) | 1,300 g |
| 🚿 Hot Shower (10 mins) | 2,000 g |
| 🚙 Daily Commute (one hour, by car) | 3,360 g |
| 🍽️ Average Daily Food Consumption (three meals of 600 calories) | 4,500 g |
| *Phone use based on yearly use of 69kg per the source, Reboxed | |
Your choice of transportation plays a crucial role in determining your carbon footprint. For instance, a 15 km daily commute to work on public transport generates an average of 1,464 g of CO₂ emissions. Compared to 3,360 g—twice the volume for a journey the same length by car.
By opting for more sustainable modes of transport, such as cycling, walking, or public transportation, you can significantly reduce your carbon footprint.
Addressing Your Carbon Footprint
One way to compensate for your emissions is by purchasing high-quality carbon credits.
Carbon credits are used to help fund projects that avoid, reduce or remove CO₂ emissions. This includes nature-based solutions such as reforestation and improved forest management, or technology-based solutions such as the production of biochar and carbon capture and storage (CCS).
While carbon credits offer a potential solution for individuals to help reduce global emissions, public awareness remains a significant challenge. A BCG-Patch survey revealed that only 34% of U.S. consumers are familiar with carbon credits, and only 3% have purchased them in the past.
About Carbon Streaming
By financing the creation or expansion of carbon projects, Carbon Streaming Corporation secures the rights to future carbon credits generated by these sustainable projects. You can then purchase these carbon credits to help fund climate solutions around the world and compensate for your own emissions.
Ready to get involved?
>> Learn more about purchasing carbon credits at Carbon Streaming

-

 Travel1 week ago
Airline Incidents: How Do Boeing and Airbus Compare?
-

 Markets2 weeks ago
Visualizing America’s Shortage of Affordable Homes
-

 Green2 weeks ago
Ranked: Top Countries by Total Forest Loss Since 2001
-

 Money2 weeks ago
Where Does One U.S. Tax Dollar Go?
-

 Misc2 weeks ago
Almost Every EV Stock is Down After Q1 2024
-

 AI2 weeks ago
The Stock Performance of U.S. Chipmakers So Far in 2024
-

 Markets2 weeks ago
Charted: Big Four Market Share by S&P 500 Audits
-

 Real Estate2 weeks ago
Ranked: The Most Valuable Housing Markets in America