Economy
Mapped: Economic Freedom Around the World


Mapped: Economic Freedom Around the World
How would you define a country’s economic freedom?
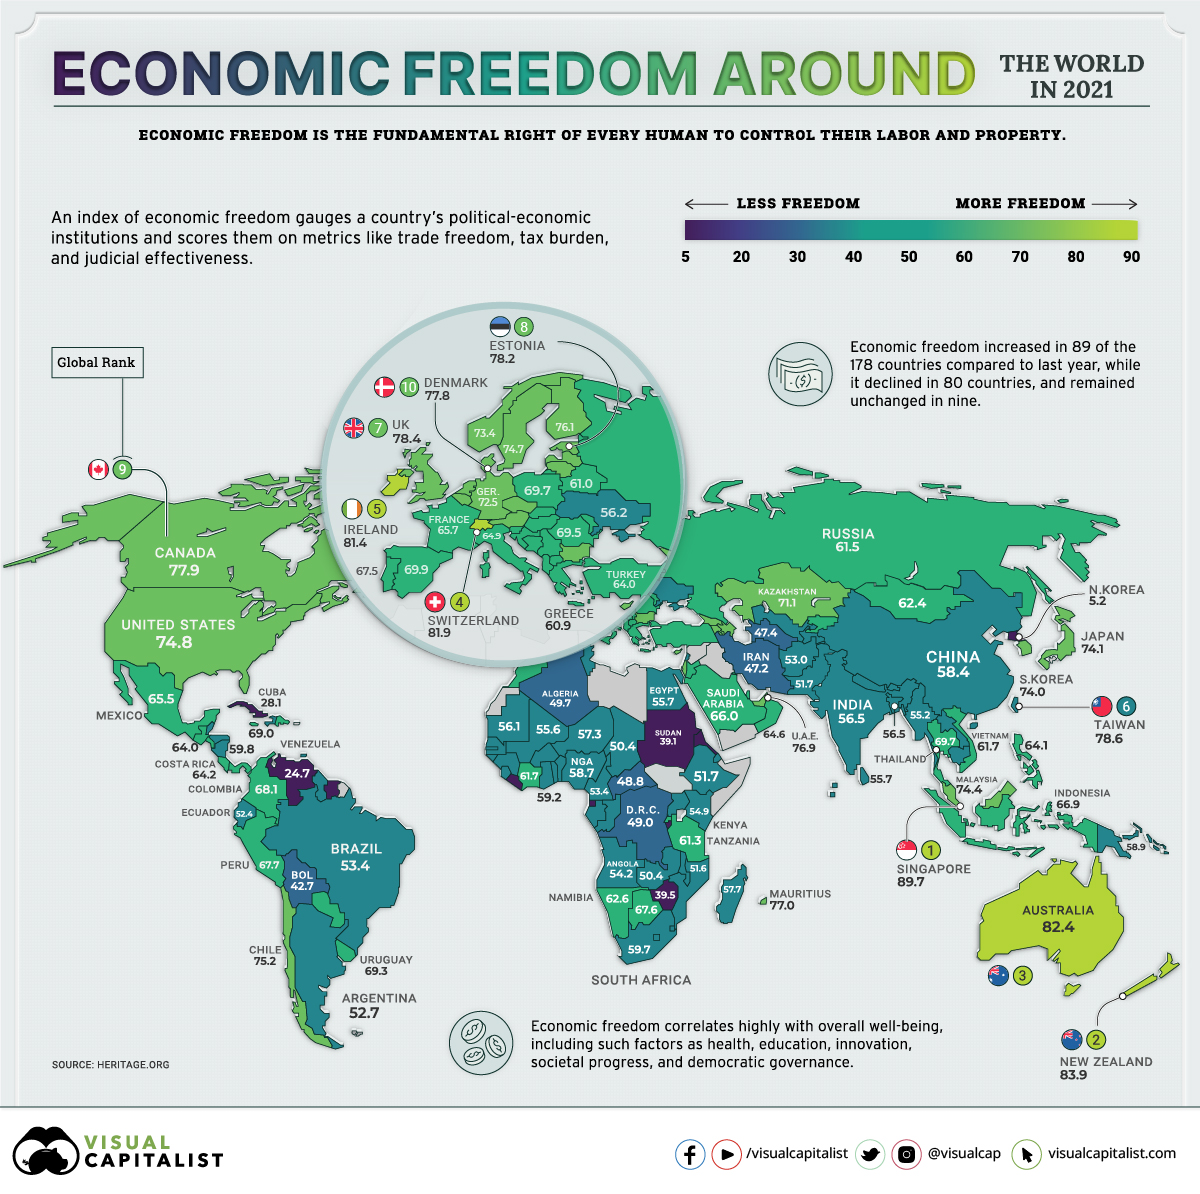
The cornerstones of economic freedom by most measures are personal choice, voluntary exchange, independence to compete in markets, and security of the person and privately-owned property. Simply put, it is about the quality of political and economic institutions in countries.
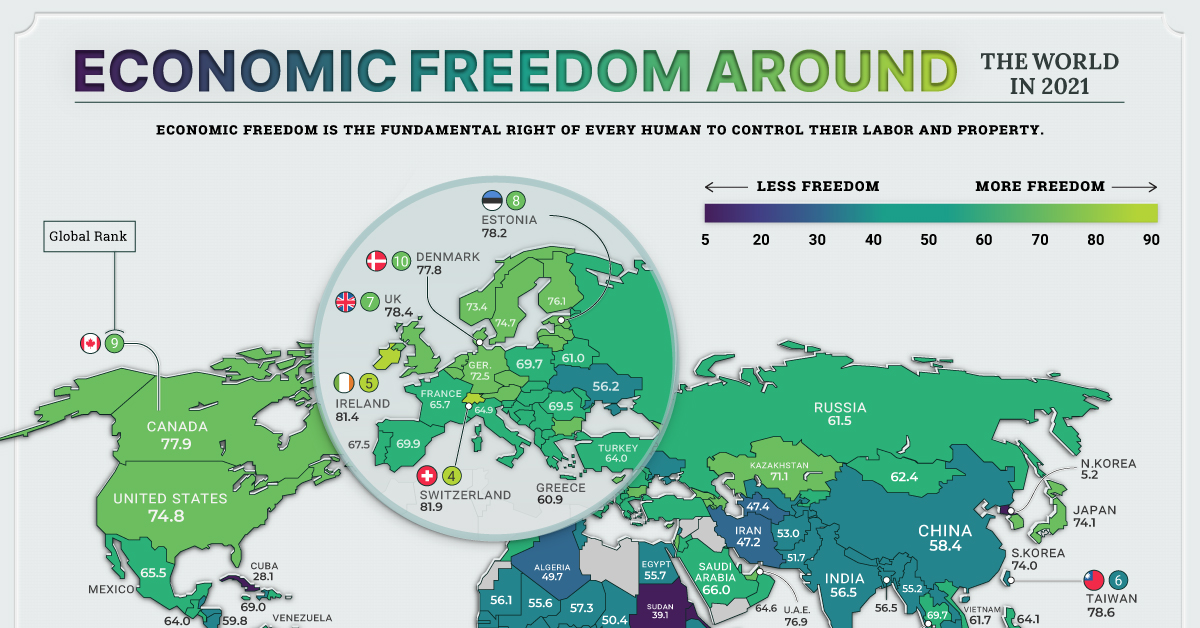
Based on the Index of Economic Freedom by the Heritage Organization, we mapped the economic freedom of 178 countries worldwide.
Measures of Economic Freedom
The index uses five broad areas to score economic freedom for each country:
- Size of Government: Greater government spending, taxation, and bigger government agencies tend to reduce individual choice and economic freedom.
- Legal System and Property Rights: The ability to accumulate private property and wealth is a central motivating force for workers and investors in a market economy, and well-functioning legal frameworks protect the rights of all citizens.
- Sound Money: Does earned money maintain its value, or is it lost to inflation? When inflation is high and volatile, individuals can’t plan for the future and use economic freedom effectively.
- Freedom to Trade Internationally: Freedom to exchange—in its broadest sense, buying, selling, making contracts, and so on—is considered essential to economic prosperity. Limited international trading options significantly reduce the potential for growth.
- Regulation: When governments utilize tools and impose oppressive regulations that limit the right to exchange, economic freedom typically suffers.
World Economic Freedom by Region
In 2021, the global average economic freedom score is 61.6, the highest its been in 27 years.
But from Mauritius and smaller African nations being beacons of hope to East Asian and Oceanic countries epitomizing economic democracy, every region has a different story to tell.
Let’s take a look at the economic freedom of each region in the world.
Americas
Even though the U.S. and Canada continue to be some of the most economically free countries globally, some markers are suffering.
The regional average unemployment rate has risen to 6.9%, and inflation (outside of Venezuela) has increased to 5.2%. The region’s average level of public debt—already the highest globally—rose to 85.2% of its GDP during the past year.
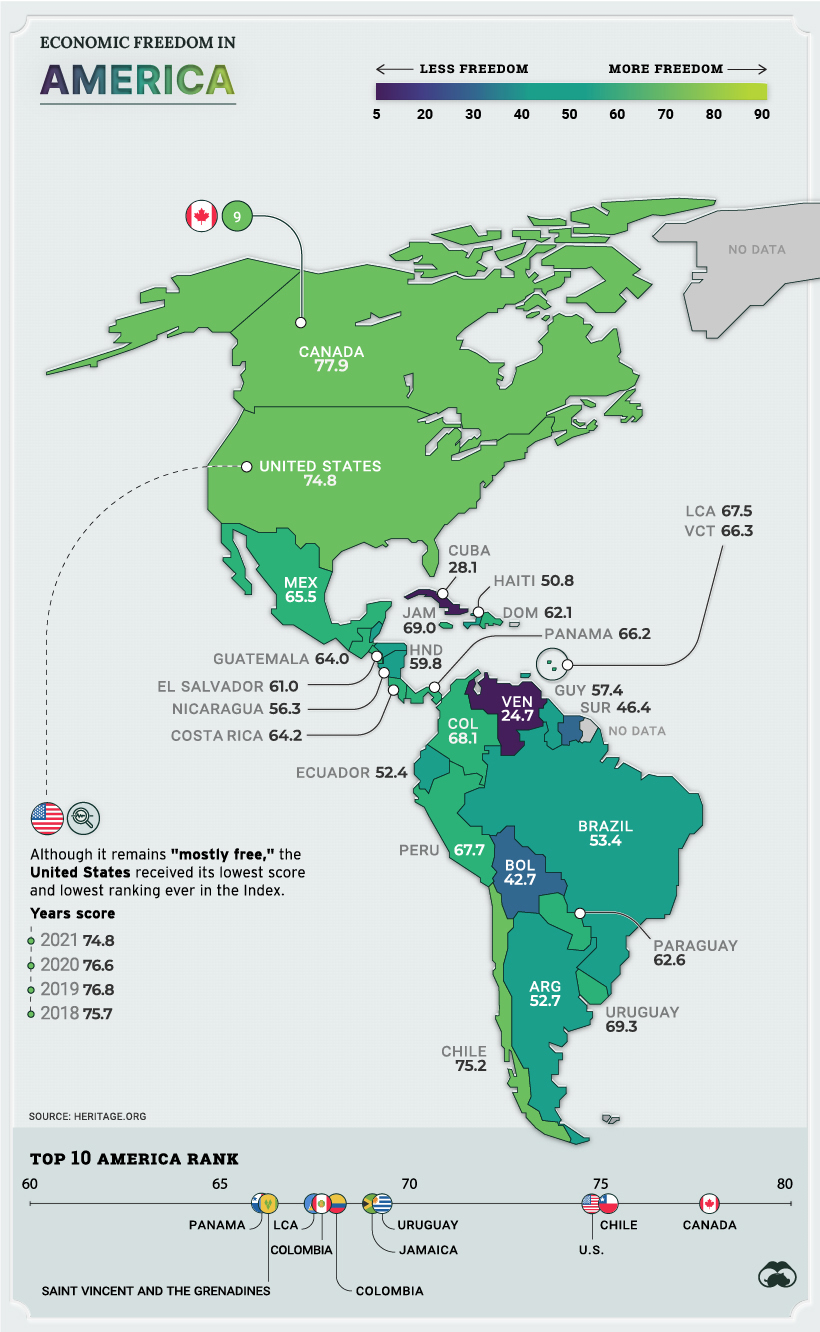
Across many Latin American countries, widespread corruption and weak protection of property rights have aggravated regulatory inefficiency and monetary instability.
For example, Argentina’s Peronist government has recently fixed the price of 1,432 products as a response to a 3.5% price rise in September, the equivalent to a 53% increase if annualized.
Europe
More than half of the world’s 38 freest countries (with overall scores above 70) are in Europe. This is due to the region’s relatively extensive and long-established free-market institutions, the robust rule of law, and exceptionally strong investment freedom.
However, Europe still struggles with a variety of policy barriers to vigorous economic expansion. This includes overly protective and costly labor regulations, which was one of the major reasons why the UK voted to leave the EU.
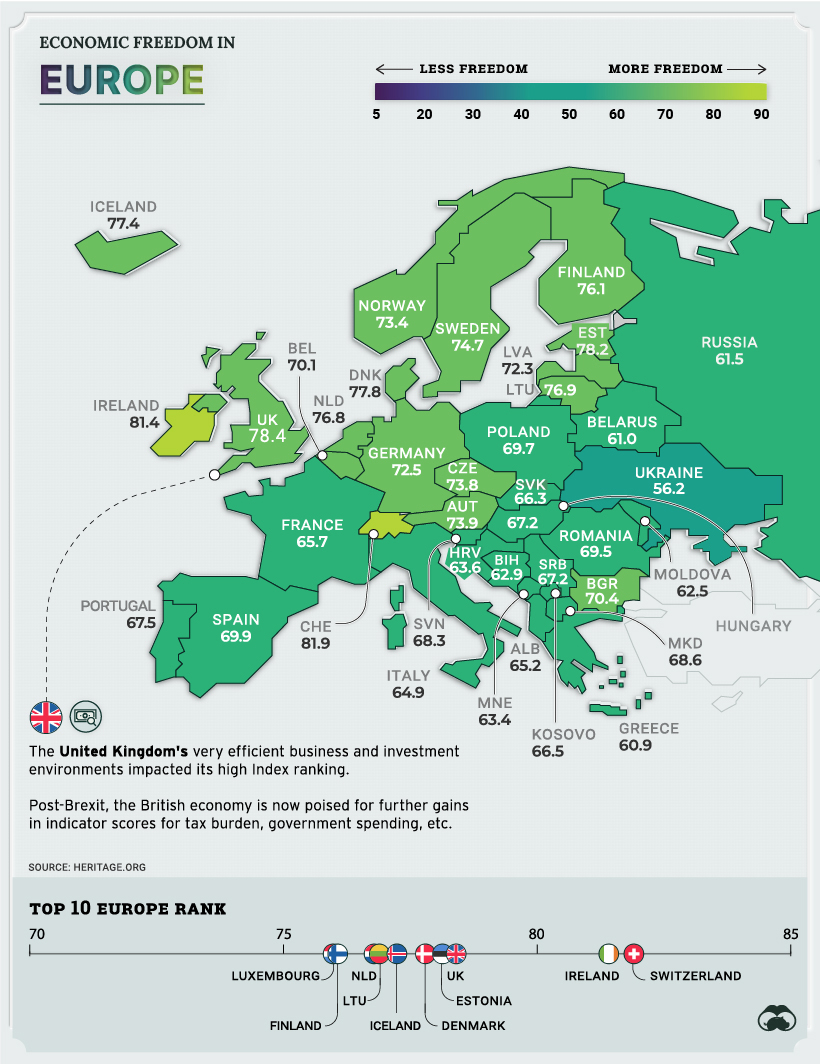
Brexit has since had a major impact on the region.
Even a year later, official UK figures showed a record fall in trade with the EU in January 2021, as the economy struggled with post-Brexit rules and the pandemic.
Africa
Dictatorships, corruption, and conflict have historically kept African nations as some of the most economically repressed in the world.
While larger and more prosperous African nations struggle to advance economic freedom, some smaller countries are becoming the beacon of hope for the continent.
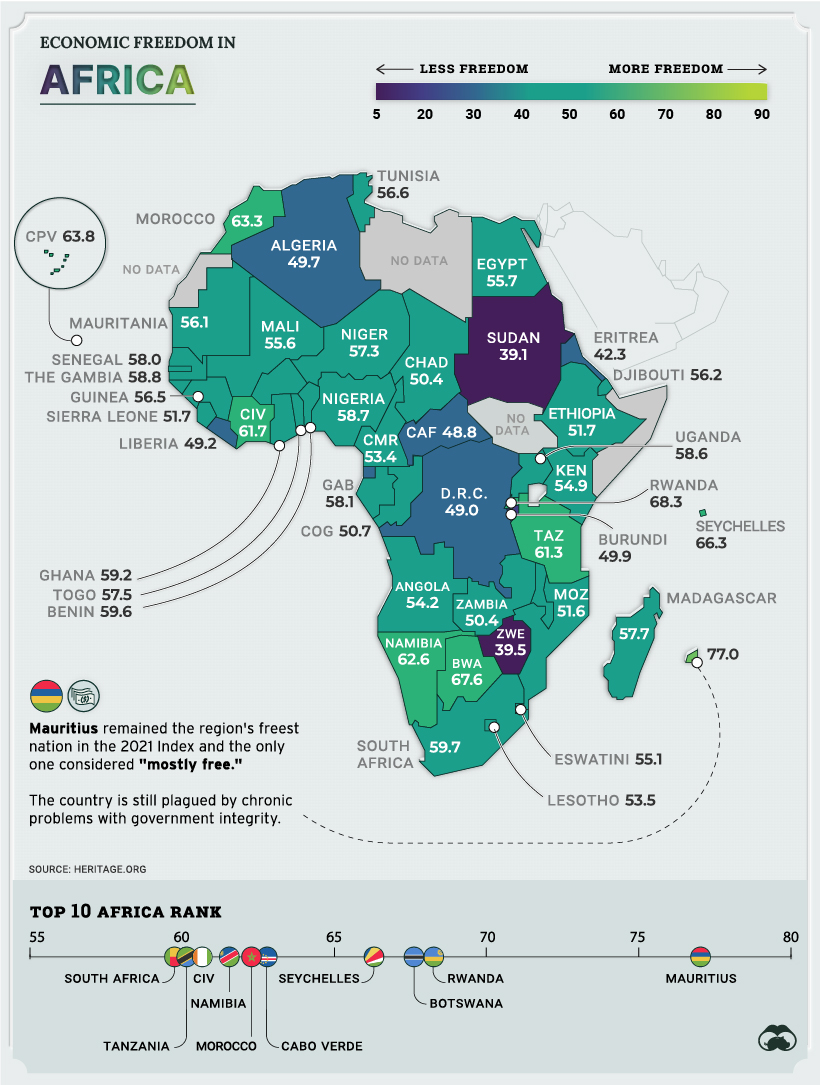
Mauritius (rank 11), Seychelles (43) and Botswana (45) were the top African countries, offering the most robust policies and institutions supporting economic self-sufficiency.
From property rights to financial freedom, small African countries are racing ahead of the continent’s largest in advancing economic autonomy as they look to build business opportunities for their citizens.
Middle East and Central Asia
When Israel, the UAE, and Bahrain signed the Abraham Accords last year, there was a sense of a new paradigm emerging in a region with a long history of strife.
A year into the signing of this resolution, the effects have been promising. There have been bilateral initiatives within the private sector and civil society leading to increasing economic and political stability in the region.
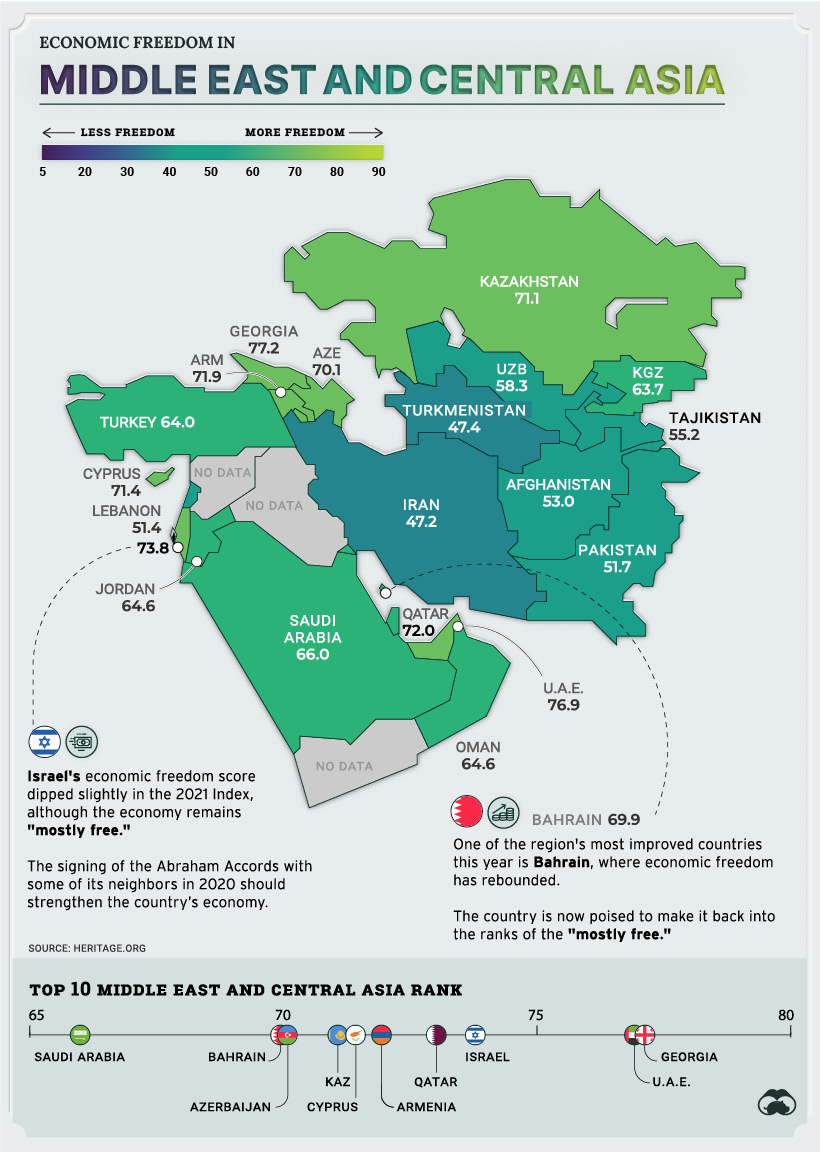
Central Asian countries once part of the Soviet Union have recently starting integrating more directly with the world economy, primarily through natural resource exports. In total, natural resources account for about 65% of exports in Kyrgyzstan, Tajikistan, and Uzbekistan, and more than 90% in Kazakhstan and Turkmenistan.
Despite this progress, these countries have a long way to go in terms of economic freedom. Uzbekistan (108), Turkmenistan (167) and Tajikistan (134) are still some of the lowest-ranked countries in the world.
East Asia and Oceania
Despite massive populations and strong economies, countries like China and India remain mostly unfree economies. The modest improvements in scores over the last few years have been through gains in property rights, judicial effectiveness, and business freedom indicators.
Nearby, Singapore’s economy has been ranked the freest in the world for the second year in a row. Singapore remains the only country in the world that is considered economically free in every index category.
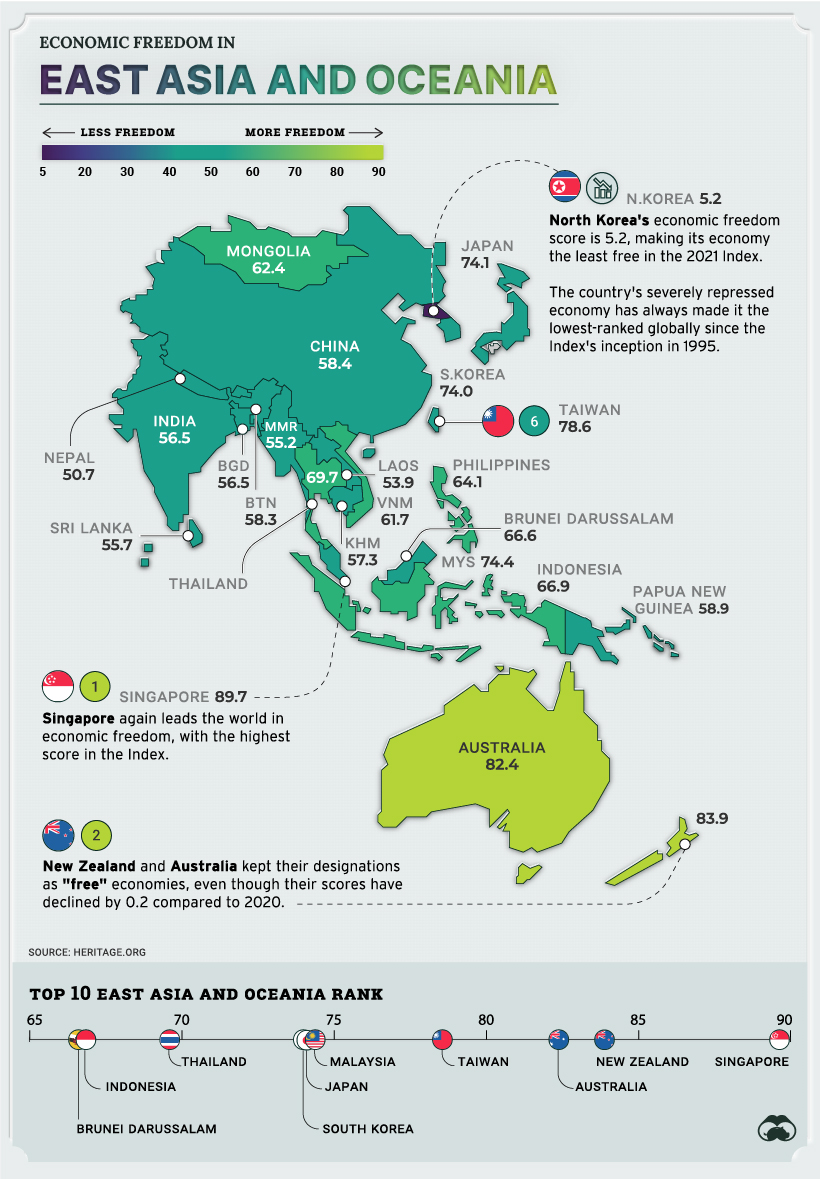
Finally, it’s worth noting that Australia and New Zealand are regional leaders, and are two of only five nations that are currently in the “free” category of the index.


Economy
The Bloc Effect: International Trade with Geopolitical Allies on the Rise
Rising geopolitical tensions are shaping the future of international trade, but what is the effect on trading among G7 and BRICS countries?


The Bloc Effect: International Trade with Allies on the Rise
International trade has become increasingly fragmented over the last five years as countries have shifted to trading more with their geopolitical allies.
This graphic from The Hinrich Foundation, the first in a three-part series covering the future of trade, provides visual context to the growing divide in trade in G7 and pre-expansion BRICS countries, which are used as proxies for geopolitical blocs.
Trade Shifts in G7 and BRICS Countries
This analysis uses IMF data to examine differences in shares of exports within and between trading blocs from 2018 to 2023. For example, we looked at the percentage of China’s exports with other BRICS members as well as with G7 members to see how these proportions shifted in percentage points (pp) over time.
Countries traded nearly $270 billion more with allies in 2023 compared to 2018. This shift came at the expense of trade with rival blocs, which saw a decline of $314 billion.
Country Change in Exports Within Bloc (pp) Change in Exports With Other Bloc (pp)
🇮🇳 India 0.0 3.9
🇷🇺 Russia 0.7 -3.8
🇮🇹 Italy 0.8 -0.7
🇨🇦 Canada 0.9 -0.7
🇫🇷 France 1.0 -1.1
🇪🇺 EU 1.1 -1.5
🇩🇪 Germany 1.4 -2.1
🇿🇦 South Africa 1.5 1.5
🇺🇸 U.S. 1.6 -0.4
🇯🇵 Japan 2.0 -1.7
🇨🇳 China 2.1 -5.2
🇧🇷 Brazil 3.7 -3.3
🇬🇧 UK 10.2 0.5
All shifts reported are in percentage points. For example, the EU saw its share of exports to G7 countries rise from 74.3% in 2018 to 75.4% in 2023, which equates to a 1.1 percentage point increase.
The UK saw the largest uptick in trading with other countries within the G7 (+10.2 percentage points), namely the EU, as the post-Brexit trade slump to the region recovered.
Meanwhile, the U.S.-China trade dispute caused China’s share of exports to the G7 to fall by 5.2 percentage points from 2018 to 2023, the largest decline in our sample set. In fact, partly as a result of the conflict, the U.S. has by far the highest number of harmful tariffs in place.
The Russia-Ukraine War and ensuing sanctions by the West contributed to Russia’s share of exports to the G7 falling by 3.8 percentage points over the same timeframe.
India, South Africa, and the UK bucked the trend and continued to witness advances in exports with the opposing bloc.
Average Trade Shifts of G7 and BRICS Blocs
Though results varied significantly on a country-by-country basis, the broader trend towards favoring geopolitical allies in international trade is clear.
Bloc Change in Exports Within Bloc (pp) Change in Exports With Other Bloc (pp)
Average 2.1 -1.1
BRICS 1.6 -1.4
G7 incl. EU 2.4 -1.0
Overall, BRICS countries saw a larger shift away from exports with the other bloc, while for G7 countries the shift within their own bloc was more pronounced. This implies that though BRICS countries are trading less with the G7, they are relying more on trade partners outside their bloc to make up for the lost G7 share.
A Global Shift in International Trade and Geopolitical Proximity
The movement towards strengthening trade relations based on geopolitical proximity is a global trend.
The United Nations categorizes countries along a scale of geopolitical proximity based on UN voting records.
According to the organization’s analysis, international trade between geopolitically close countries rose from the first quarter of 2022 (when Russia first invaded Ukraine) to the third quarter of 2023 by over 6%. Conversely, trade with geopolitically distant countries declined.
The second piece in this series will explore China’s gradual move away from using the U.S. dollar in trade settlements.
Visit the Hinrich Foundation to learn more about the future of geopolitical trade

-

 Markets1 week ago
Ranked: The Largest U.S. Corporations by Number of Employees
We visualized the top U.S. companies by employees, revealing the massive scale of retailers like Walmart, Target, and Home Depot.
-

 Economy2 weeks ago
Where U.S. Inflation Hit the Hardest in March 2024
We visualized product categories that saw the highest % increase in price due to U.S. inflation as of March 2024.
-

 Economy4 weeks ago
G20 Inflation Rates: Feb 2024 vs COVID Peak
We visualize inflation rates across G20 countries as of Feb 2024, in the context of their COVID-19 pandemic peak.
-

 Economy4 weeks ago
Mapped: Unemployment Claims by State
This visual heatmap of unemployment claims by state highlights New York, California, and Alaska leading the country by a wide margin.
-

 Markets2 months ago
Confidence in the Global Economy, by Country
Will the global economy be stronger in 2024 than in 2023?
-

 Maps2 months ago
Mapped: Breaking Down the $3 Trillion African Economy by Country
The top three economic powerhouses of Africa contribute more than one-third to the African economy. We rank the nations of the world’s second-largest continent by 2024…


-

 Green1 week ago
Ranking the Top 15 Countries by Carbon Tax Revenue
-

 Technology2 weeks ago
The Stock Performance of U.S. Chipmakers So Far in 2024
-

 Markets2 weeks ago
Charted: Big Four Market Share by S&P 500 Audits
-

 Real Estate2 weeks ago
Ranked: The Most Valuable Housing Markets in America
-

 Money2 weeks ago
Which States Have the Highest Minimum Wage in America?
-

 AI2 weeks ago
Ranked: Semiconductor Companies by Industry Revenue Share
-

 Travel2 weeks ago
Ranked: The World’s Top Flight Routes, by Revenue
-

 Countries2 weeks ago
Population Projections: The World’s 6 Largest Countries in 2075