Markets
Visualizing How COVID-19 Has Impacted Global Wages
Visualizing How COVID-19 Impacted Global Wages
In the years leading up to the pandemic, annual global wage growth was fluctuating stably between 1.6%–2.2%. Now, income, working hours, and employment have all been impacted by COVID-19—but for those who have held onto their jobs, how have wages been affected?
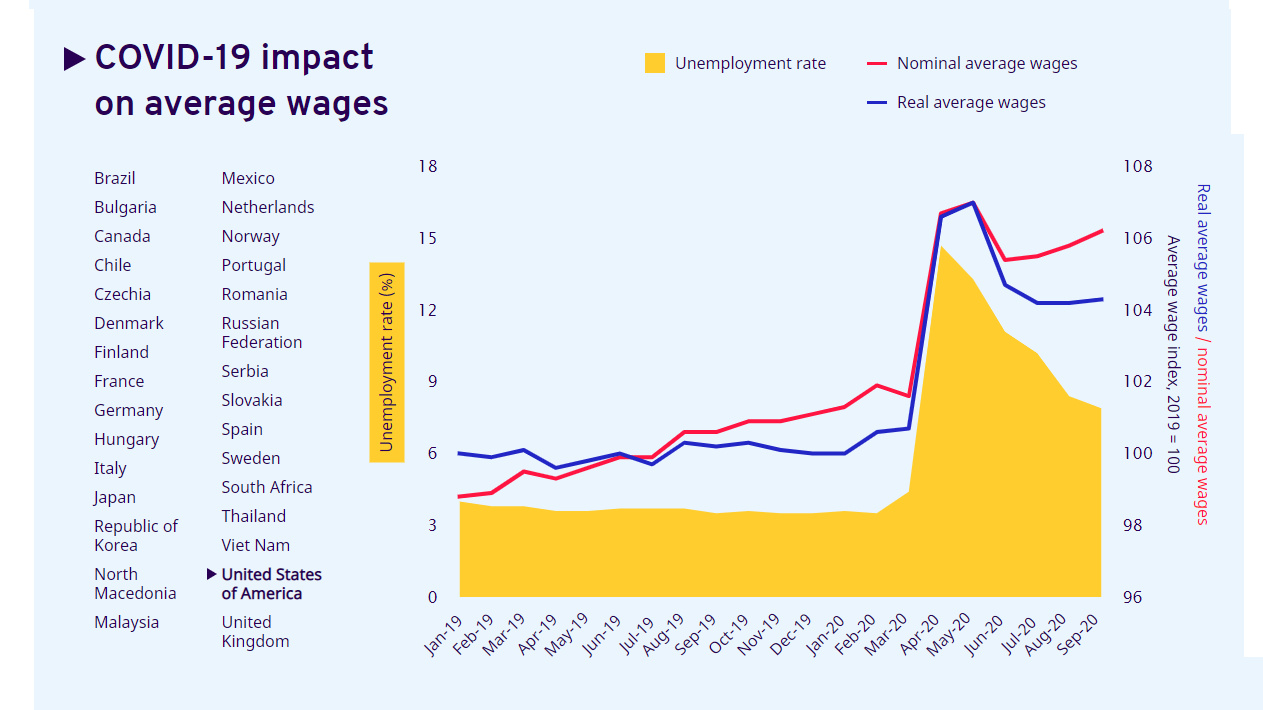
This interactive chart from the International Labour Organization (ILO) reveals how the global pandemic has affected both nominal and real wages, as well as unemployment rates.
The date of data collection varies on a country-by-country basis, using the most recent available data. The most recent measurement of wage indices is from September 2020 in some countries and the least recent available data comes from Q2’2020. In select countries the date of unemployment rates and wage indices are different. As a point of reference, the average wage index in 2019 was 100.
Note: the ILO uses national statistics databases and only the select countries had enough recent, available data for all three elements: nominal wages, real wages, and unemployment.
Where Average Wages are Falling
Average wages in many countries either plateaued or decreased significantly during the global pandemic. Sharp declines happened across a number of European countries, as well as in South Africa and Japan, for example.
| Country | Unemployment Rate | Real Wage Index | Nominal Wage Index |
|---|---|---|---|
| 🇻🇳 Vietnam (as of Q2'2020) | 2.7% | 92.4 | 94.4 |
| 🇪🇸 Spain (as of Q2'2020) | 15.3% | 92.5 | 92.3 |
| 🇲🇽 Mexico (as of August 2020) | 5% | 94.4 | 98 |
| 🇿🇦 South Africa (as of Q2'2020) | 23.3% | 95.2 | 97.4 |
| 🇰🇷 South Korea (as of August 2020) | 3.1% | 96.2 | 96.8 |
| 🇷🇺 Russia (as of August 2020) | 6.4% | 96.9 | 100.5 |
| 🇨🇿 Czech Republic (as of Q2'2020) | 6.6% | 97.8 | 99.6 |
| 🇸🇰 Slovakia (as of Q2'2020) | 6.6% | 97.8 | 99.6 |
| 🇯🇵 Japan (as of August 2020) | 3% | 98.6 | 98.7 |
| 🇫🇮 Finland (as of August 2020) | 7.9% | 99.6 | 100.1 |
| 🇩🇪 Germany (as of Q2'2020) | 4.4% | 99.6 | 100.5 |
Falling wages, however, do not necessarily mean that people are receiving less money, as many subsidies have been put in place to help cushion income or job loss.
In many cases where wage indices declined, employment did not. This is because different job retention schemes were put in place, wherein workers were furloughed, but were given a portion of their wages from the national government. This allowed unemployment rates to remain steady while wages tapered off.
In Europe, where wages have dropped considerably in many countries, wage subsidies have compensated for nearly 40% of wage bill loss in select countries. But while high income countries can afford to inject stimulus into their economies, most lower income countries cannot. This has come to be described as the fiscal stimulus gap.
Where Average Wages are Rising
While perhaps counterintuitive, rising average wages are in no way an inherent sign of a recovering economy or labor market. Regardless, when compared to 2019, wages have actually increased in the majority of countries, such as Brazil, Canada, United States, Italy, and the UK.
| Country | Unemployment Rate | Real Wage Index | Nominal Wage Index |
|---|---|---|---|
| 🇨🇦 Canada (as of August 2020) | 10.6% | 107.6 | 108.4 |
| 🇲🇰 North Macedonia (Unemployment: Jun '20; wage data: Aug '20) | 16.7% | 107.6 | 109.7 |
| 🇧🇷 Brazil (as of Q2'2020) | 13.3% | 107.3 | 109.6 |
| 🇧🇬 Bulgaria (as of June 2020) | 5.9% | 106.9 | 107.8 |
| 🇭🇺 Hungary (as of August 2020) | 4.4% | 106.3 | 106.5 |
| 🇮🇹 Italy (as of Q2'2020) | 8.3% | 106.2 | 106.2 |
| 🇫🇷 France (as of Q2'2020) | 7.1% | 105.4 | 105.9 |
| 🇷🇸 Serbia (Unemployment: Jun '20; wage data: Aug '20) | 7.7% | 104.7 | 106.7 |
| 🇳🇴 Norway (as of Q2'2020) | 4.6% | 104.5 | 105.6 |
| 🇺🇸 U.S. (as of September 2020) | 7.9% | 104.3 | 106.2 |
| 🇵🇹 Portugal (as of June 2020) | 7.3% | 103.2 | 104.2 |
| 🇹🇭 Thailand (as of Q2'2020) | 2% | 103 | 100.6 |
| 🇷🇴 Romania (as of August 2020) | 5.3% | 102.5 | 105.2 |
| 🇳🇱 Netherlands (as of September 2020) | 4.4% | 102 | 103.6 |
| 🇬🇧 UK (as of September 2020) | 4.8% | 101.5 | 102.4 |
| 🇩🇰 Denmark (as of Q2'2020) | 5.3% | 101.4 | 101.5 |
| 🇸🇪 Sweden (as of August 2020) | 8.8% | 100.8 | 101.6 |
| 🇨🇱 Chile (as of August 2020) | 12.3% | 100.6 | 103.4 |
| 🇲🇾 Malaysia (as of June 2020) | 4.7% | 100.2 | 99 |
One reason for higher average wages is something called the compositional effect. The compositional effect is what occurs when wages are not actually increasing, but the makeup of employment changes. For example, the loss and subsequent absence of many lower paying jobs from the labor market due to COVID-19 can skew the average wage upwards.
Brazil is a prime example of the compositional effect. As both nominal and real wages increase, so does unemployment. Brazil’s current unemployment rate is 13.3%, while wages have skyrocketed to a real wage index of 107.3 during the first half of 2020.
The loss of these lower paying jobs has been extremely widespread, most negatively impacting informal workers, self-employed vendors, and migrant workers. Some policymakers have seen this as an opportunity to call for universal basic income. Even with job retention schemes to keep unemployment steady, many people are earning far less income and may never return to normal working hours in their current positions.


Markets
Mapped: Europe’s GDP Per Capita, by Country
Which European economies are richest on a GDP per capita basis? This map shows the results for 44 countries across the continent.


Mapped: Europe’s GDP Per Capita, by Country (2024)
This was originally posted on our Voronoi app. Download the app for free on iOS or Android and discover incredible data-driven charts from a variety of trusted sources.
Europe is home to some of the largest and most sophisticated economies in the world. But how do countries in the region compare with each other on a per capita productivity basis?
In this map, we show Europe’s GDP per capita levels across 44 nations in current U.S. dollars. Data for this visualization and article is sourced from the International Monetary Fund (IMF) via their DataMapper tool, updated April 2024.
Europe’s Richest and Poorest Nations, By GDP Per Capita
Luxembourg, Ireland, and Switzerland, lead the list of Europe’s richest nations by GDP per capita, all above $100,000.
| Rank | Country | GDP Per Capita (2024) |
|---|---|---|
| 1 | 🇱🇺 Luxembourg | $131,380 |
| 2 | 🇮🇪 Ireland | $106,060 |
| 3 | 🇨🇭 Switzerland | $105,670 |
| 4 | 🇳🇴 Norway | $94,660 |
| 5 | 🇮🇸 Iceland | $84,590 |
| 6 | 🇩🇰 Denmark | $68,900 |
| 7 | 🇳🇱 Netherlands | $63,750 |
| 8 | 🇸🇲 San Marino | $59,410 |
| 9 | 🇦🇹 Austria | $59,230 |
| 10 | 🇸🇪 Sweden | $58,530 |
| 11 | 🇧🇪 Belgium | $55,540 |
| 12 | 🇫🇮 Finland | $55,130 |
| 13 | 🇩🇪 Germany | $54,290 |
| 14 | 🇬🇧 UK | $51,070 |
| 15 | 🇫🇷 France | $47,360 |
| 16 | 🇦🇩 Andorra | $44,900 |
| 17 | 🇲🇹 Malta | $41,740 |
| 18 | 🇮🇹 Italy | $39,580 |
| 19 | 🇨🇾 Cyprus | $37,150 |
| 20 | 🇪🇸 Spain | $34,050 |
| 21 | 🇸🇮 Slovenia | $34,030 |
| 22 | 🇪🇪 Estonia | $31,850 |
| 23 | 🇨🇿 Czech Republic | $29,800 |
| 24 | 🇵🇹 Portugal | $28,970 |
| 25 | 🇱🇹 Lithuania | $28,410 |
| 26 | 🇸🇰 Slovakia | $25,930 |
| 27 | 🇱🇻 Latvia | $24,190 |
| 28 | 🇬🇷 Greece | $23,970 |
| 29 | 🇭🇺 Hungary | $23,320 |
| 30 | 🇵🇱 Poland | $23,010 |
| 31 | 🇭🇷 Croatia | $22,970 |
| 32 | 🇷🇴 Romania | $19,530 |
| 33 | 🇧🇬 Bulgaria | $16,940 |
| 34 | 🇷🇺 Russia | $14,390 |
| 35 | 🇹🇷 Türkiye | $12,760 |
| 36 | 🇲🇪 Montenegro | $12,650 |
| 37 | 🇷🇸 Serbia | $12,380 |
| 38 | 🇦🇱 Albania | $8,920 |
| 39 | 🇧🇦 Bosnia & Herzegovina | $8,420 |
| 40 | 🇲🇰 North Macedonia | $7,690 |
| 41 | 🇧🇾 Belarus | $7,560 |
| 42 | 🇲🇩 Moldova | $7,490 |
| 43 | 🇽🇰 Kosovo | $6,390 |
| 44 | 🇺🇦 Ukraine | $5,660 |
| N/A | 🇪🇺 EU Average | $44,200 |
Note: Figures are rounded.
Three Nordic countries (Norway, Iceland, Denmark) also place highly, between $70,000-90,000. Other Nordic peers, Sweden and Finland rank just outside the top 10, between $55,000-60,000.
Meanwhile, Europe’s biggest economies in absolute terms, Germany, UK, and France, rank closer to the middle of the top 20, with GDP per capitas around $50,000.
Finally, at the end of the scale, Eastern Europe as a whole tends to have much lower per capita GDPs. In that group, Ukraine ranks last, at $5,660.
A Closer Look at Ukraine
For a broader comparison, Ukraine’s per capita GDP is similar to Iran ($5,310), El Salvador ($5,540), and Guatemala ($5,680).
According to experts, Ukraine’s economy has historically underperformed to expectations. After the fall of the Berlin Wall, the economy contracted for five straight years. Its transition to a Western, liberalized economic structure was overshadowed by widespread corruption, a limited taxpool, and few revenue sources.
Politically, its transformation from authoritarian regime to civil democracy has proved difficult, especially when it comes to institution building.
Finally, after the 2022 invasion of the country, Ukraine’s GDP contracted by 30% in a single year—the largest loss since independence. Large scale emigration—to the tune of six million refugees—is also playing a role.
Despite these challenges, the country’s economic growth has somewhat stabilized while fighting continues.

-

 Markets6 days ago
Visualized: Interest Rate Forecasts for Advanced Economies
-

 Markets2 weeks ago
Economic Growth Forecasts for G7 and BRICS Countries in 2024
-

 Wealth2 weeks ago
Charted: Which City Has the Most Billionaires in 2024?
-

 Technology2 weeks ago
All of the Grants Given by the U.S. CHIPS Act
-

 Green2 weeks ago
The Carbon Footprint of Major Travel Methods
-

 United States1 week ago
Visualizing the Most Common Pets in the U.S.
-

 Culture1 week ago
The World’s Top Media Franchises by All-Time Revenue
-

 voronoi1 week ago
Best Visualizations of April on the Voronoi App