Mining
The Story of Voisey’s Bay: Today’s Mine (Pt. 3 of 3)


The Story of Voisey’s Bay: Today’s Mine (Part 3 of 3)
Presented by: Equitas Resources, “Nickel exploration in Labrador”
Preface
The massive Voisey’s Bay nickel deposit was auctioned off to the highest bidder in early 1996 for $4.3 billion. We have recapped the events leading up to the sale in previous parts of this infographic series on Voisey’s Bay:
We show the events leading up to the nickel discovery in Part 1: The Discovery
We highlight the bidding war for the rights to the deposit in Part 2: The Auction
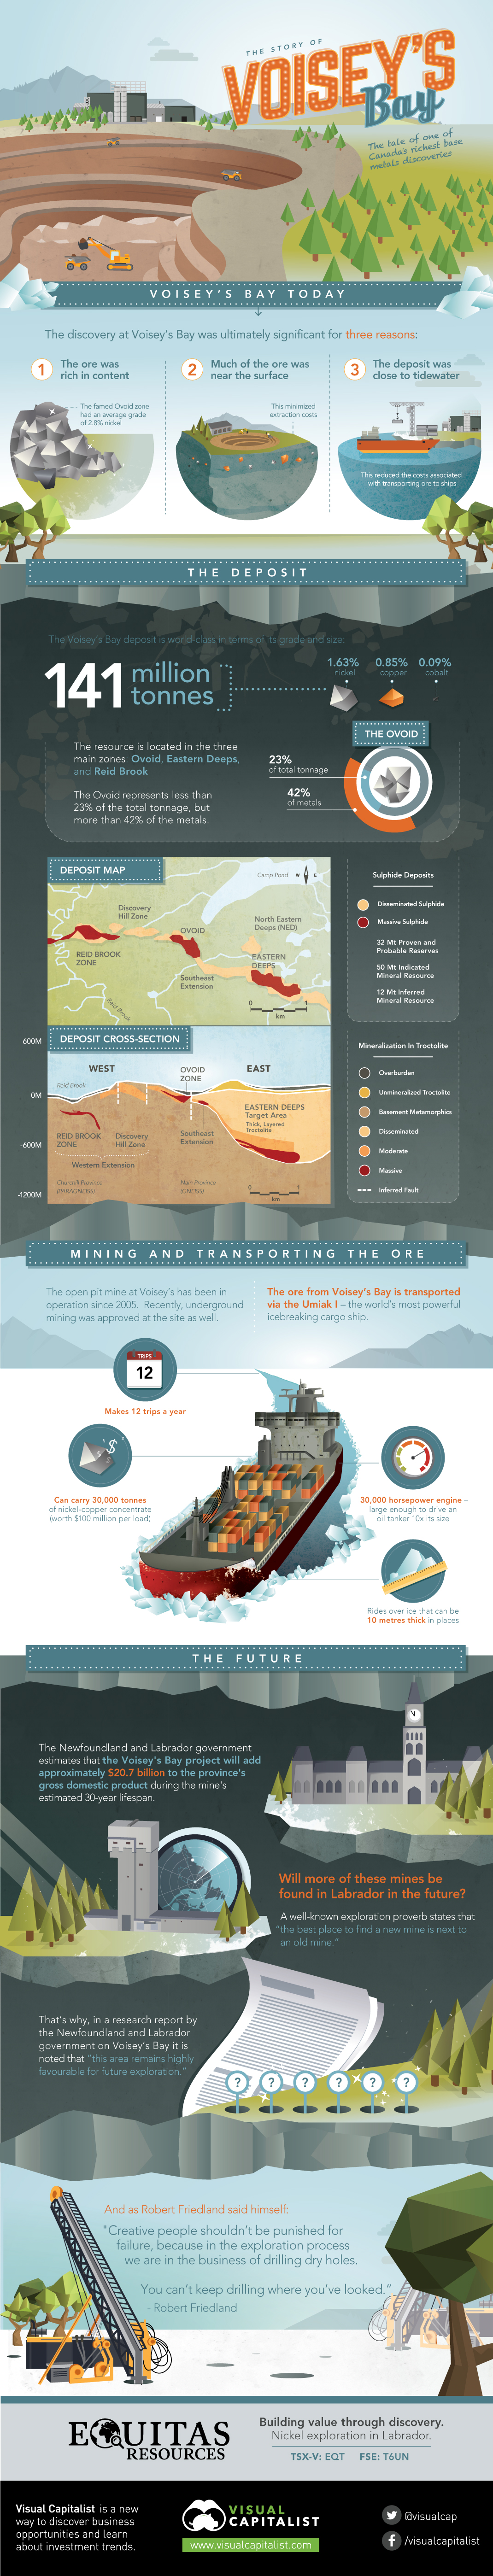
Voisey’s Bay Today
The discovery at Voisey’s Bay was ultimately significant for three reasons:
- The ore was rich in content. In fact, the famed Ovoid zone had an average grade of 2.8% nickel.
- Much of the ore was near the surface. This would help to minimize extraction costs.
- The deposit was close to tidewater. This reduced the costs associated with transporting ore to ships
The Deposit
The Voisey’s Bay deposit is world-class in terms of its grade and size. With 141 million tonnes of ore, the deposit has significant grades of nickel, copper, and cobalt:
- 1.63% nickel
- 0.85% copper
- 0.09% cobalt
The resource is located in the three main zones: Ovoid, Eastern Deeps, and Reid Brook. The Ovoid represents less than 23% of the total tonnage, but more than 42% of the metal in the deposit.
Mining and Transporting the Ore
The open pit mine at Voisey’s Bay, now owned by Vale, has been in operation since 2005. Recently, underground mining was approved at the site as well.
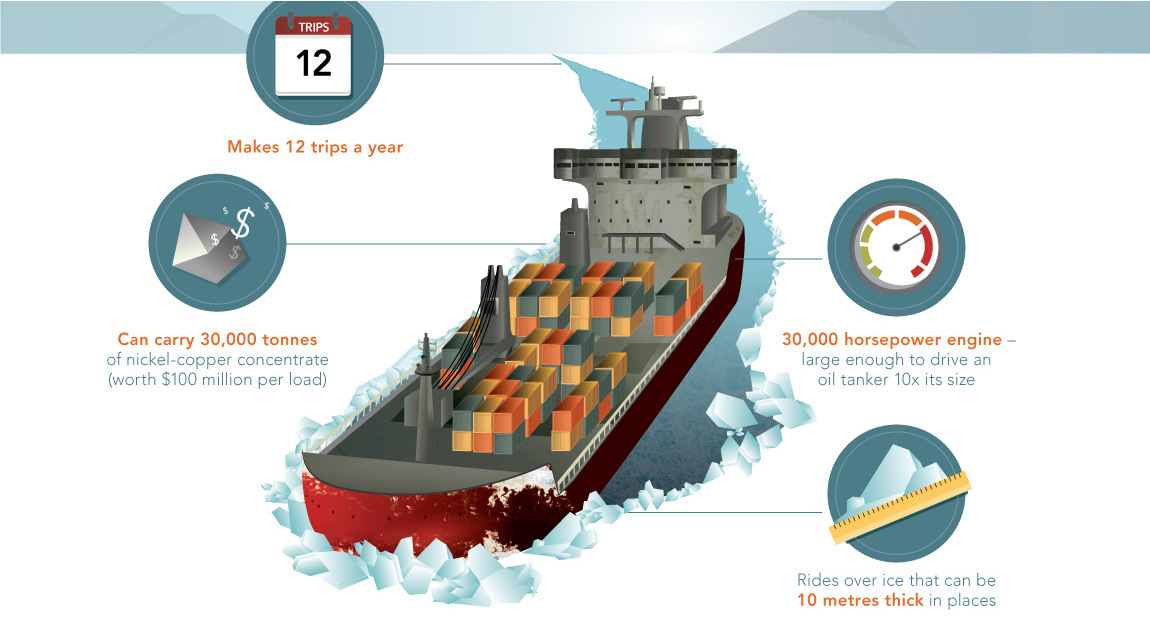
The ore from Voisey’s Bay is transported via the Umiak I – the world’s most powerful icebreaking cargo ship.
- The Umiak I makes 12 trips a year
- The icebreaker rides over ice that can be 10 metres thick in places
- It has a 30,000 horsepower engine, which is large enough to drive an oil tanker 10x its size
- The Umiak I can carry 30,000 tonnes of nickel-copper concentrate at once (worth $100 million per load)
The Future
The Newfoundland and Labrador government estimated that the Voisey’s Bay project will add approximately $20.7 billion to the province’s gross domestic product during the mine’s estimated 30-year lifespan.
Will more of these mines be found in Labrador in the future?
A well-known exploration proverb states that “the best place to find a new mine is next to an old mine”.
That’s why, in a research report by the Newfoundland and Labrador government on Voisey’s Bay it is noted that “this area remains highly favourable for future exploration.”
And as Robert Friedland has said himself:
“Creative people shouldn’t be punished for failure, because in the exploration process we are in the business of drilling dry holes. You can’t keep drilling where you’ve looked.” – Robert Friedland


Lithium
Ranked: The Top 10 EV Battery Manufacturers in 2023
Asia dominates this ranking of the world’s largest EV battery manufacturers in 2023.


The Top 10 EV Battery Manufacturers in 2023
This was originally posted on our Voronoi app. Download the app for free on iOS or Android and discover incredible data-driven charts from a variety of trusted sources.
Despite efforts from the U.S. and EU to secure local domestic supply, all major EV battery manufacturers remain based in Asia.
In this graphic we rank the top 10 EV battery manufacturers by total battery deployment (measured in megawatt-hours) in 2023. The data is from EV Volumes.
Chinese Dominance
Contemporary Amperex Technology Co. Limited (CATL) has swiftly risen in less than a decade to claim the title of the largest global battery group.
The Chinese company now has a 34% share of the market and supplies batteries to a range of made-in-China vehicles, including the Tesla Model Y, SAIC’s MG4/Mulan, and various Li Auto models.
| Company | Country | 2023 Production (megawatt-hour) | Share of Total Production |
|---|---|---|---|
| CATL | 🇨🇳 China | 242,700 | 34% |
| BYD | 🇨🇳 China | 115,917 | 16% |
| LG Energy Solution | 🇰🇷 Korea | 108,487 | 15% |
| Panasonic | 🇯🇵 Japan | 56,560 | 8% |
| SK On | 🇰🇷 Korea | 40,711 | 6% |
| Samsung SDI | 🇰🇷 Korea | 35,703 | 5% |
| CALB | 🇨🇳 China | 23,493 | 3% |
| Farasis Energy | 🇨🇳 China | 16,527 | 2% |
| Envision AESC | 🇨🇳 China | 8,342 | 1% |
| Sunwoda | 🇨🇳 China | 6,979 | 1% |
| Other | - | 56,040 | 8% |
In 2023, BYD surpassed LG Energy Solution to claim second place. This was driven by demand from its own models and growth in third-party deals, including providing batteries for the made-in-Germany Tesla Model Y, Toyota bZ3, Changan UNI-V, Venucia V-Online, as well as several Haval and FAW models.
The top three battery makers (CATL, BYD, LG) collectively account for two-thirds (66%) of total battery deployment.
Once a leader in the EV battery business, Panasonic now holds the fourth position with an 8% market share, down from 9% last year. With its main client, Tesla, now sourcing batteries from multiple suppliers, the Japanese battery maker seems to be losing its competitive edge in the industry.
Overall, the global EV battery market size is projected to grow from $49 billion in 2022 to $98 billion by 2029, according to Fortune Business Insights.

-

 Debt1 week ago
How Debt-to-GDP Ratios Have Changed Since 2000
-

 Markets2 weeks ago
Ranked: The World’s Top Flight Routes, by Revenue
-

 Countries2 weeks ago
Population Projections: The World’s 6 Largest Countries in 2075
-

 Markets2 weeks ago
The Top 10 States by Real GDP Growth in 2023
-

 Demographics2 weeks ago
The Smallest Gender Wage Gaps in OECD Countries
-

 United States2 weeks ago
Where U.S. Inflation Hit the Hardest in March 2024
-

 Green2 weeks ago
Top Countries By Forest Growth Since 2001
-

 United States2 weeks ago
Ranked: The Largest U.S. Corporations by Number of Employees