Mining
The Story of Voisey’s Bay: The Discovery (1 of 3)


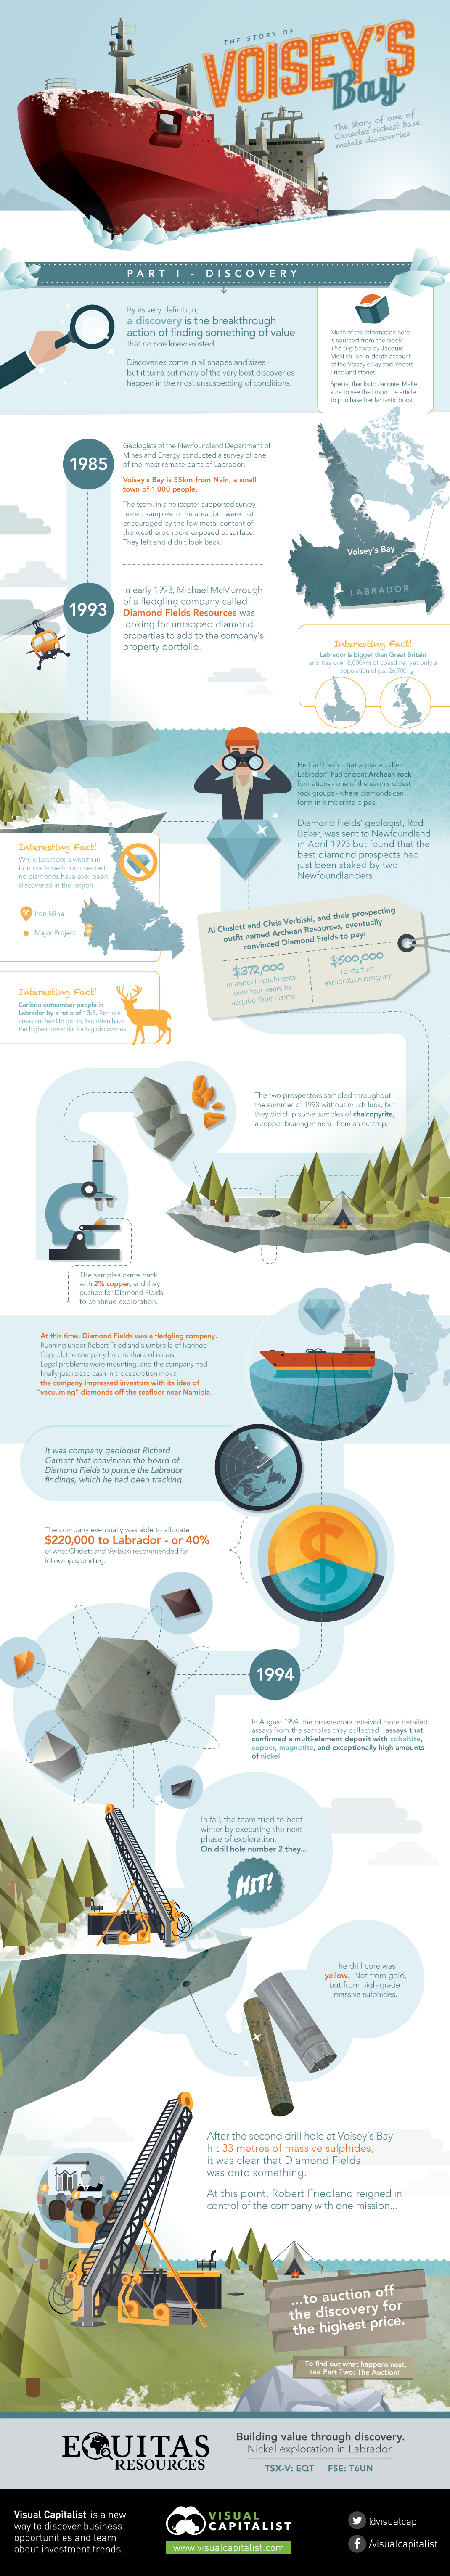
The Story of Voisey’s Bay: The Discovery (Part 1 of 3)
Presented by: Equitas Resources, “Nickel exploration in Labrador”
Preface
The legendary story of one of Canada’s most significant base metal discoveries happened just before the dawn of the internet era. While some investors recall the sequence of events and the value that was created by Diamond Fields, there are many investors today, both new and old, who are not familiar with the story of Voisey’s Bay.
For this infographic, we have turned to Jacquie McNish’s fabulous book The Big Score, which documents the history of the discovery, biographical elements of Robert Friedland’s life, and the ensuing bidding war between Inco and Falconbridge that led to one of the most spectacular takeovers in mining history. If you like these infographics, then look into buying Jacquie’s book. It was gripping and full of information.
The Origins
By its very definition, a discovery is the breakthrough action of finding something of value that no one knew existed. Discoveries come in all shapes and sizes – but it turns out many of the very best discoveries happen in the most unsuspecting of conditions.
Labrador is located on the Northeast tip of Quebec in Canada, and it’s in this remote area that the Voisey’s Bay discovery takes place. Labrador is bigger than Great Britain and has over 8,000km of coastline, yet only a population of just 26,700. For context, caribou outnumber people in Labrador by a ratio of 13:1.
In 1985, geologists of the Newfoundland Department of Mines and Energy conducted a survey of one of the most remote parts of Labrador. Voisey’s Bay is 35km from Nain, a small town of 1,000 people.
The team, in a helicopter-supported survey, tested samples in the area, but were not encouraged by the low metal content of the weathered rocks exposed at surface. They left and didn’t look back.
In early 1993, Michael McMurrough of a fledgling company called Diamond Fields Resources was looking for untapped diamond properties to add to the company’s property portfolio. He had heard that a place called “Labrador” had ancient Archean rock formations – one of the earth’s oldest rock groups – where diamonds can form in kimberlite pipes. While Labrador’s wealth in iron ore is well-documented, no diamonds have ever been discovered in the region.
Diamond Fields’ geologist, Rod Baker, was sent to Newfoundland in April 1993 but found that the best diamond prospects had just been staked by two Newfoundlanders. Al Chislett and Chris Verbiski, and their prospecting outfit named Archean Resources, eventually convinced Diamond Fields to pay $372,000 in annual instalments over four years to acquire their claims. Diamond Fields also agreed to pay $500,000 to start an exploration program.
The two prospectors sampled throughout the summer of 1993 without much luck, but they did chip some samples of chalcopyrite, a copper-bearing mineral, from an outcrop. The samples came back with 2% copper, and they pushed for Diamond Fields to put more money into the exploration program.
Diamond Fields
At this time, Diamond Fields was a fledgling company. Running under Robert Friedland’s umbrella of Ivanhoe Capital, the company had its share of issues. Legal problems were mounting, and the company had finally just raised cash in a desperation move: the company impressed investors with its idea of “vacuuming” diamonds off the seafloor near Namibia.
It was company geologist Richard Garnett that convinced the board of Diamond Fields to pursue the Labrador findings, which he had been tracking. The company eventually was able to allocate $220,000 to Labrador – or 40% of what Chislett and Verbiski recommended for follow-up spending.
The Discovery
In August 1994, the prospectors received more detailed assays from the samples they collected – assays that confirmed a multi-element deposit with cobaltite, copper, magnetite, and exceptionally high amounts of nickel. In fall, the team tried to beat winter by executing the next phase of exploration.
On drill hole number two: they hit. The drill core was yellow – not from gold, but from high-grade massive sulphides. The hole was 33 metres long, and signified that Diamond Fields was finally onto something.
At this point, Robert Friedland reigned in control of the company with one mission: to auction off the discovery for the highest price.


Lithium
Ranked: The Top 10 EV Battery Manufacturers in 2023
Asia dominates this ranking of the world’s largest EV battery manufacturers in 2023.


The Top 10 EV Battery Manufacturers in 2023
This was originally posted on our Voronoi app. Download the app for free on iOS or Android and discover incredible data-driven charts from a variety of trusted sources.
Despite efforts from the U.S. and EU to secure local domestic supply, all major EV battery manufacturers remain based in Asia.
In this graphic we rank the top 10 EV battery manufacturers by total battery deployment (measured in megawatt-hours) in 2023. The data is from EV Volumes.
Chinese Dominance
Contemporary Amperex Technology Co. Limited (CATL) has swiftly risen in less than a decade to claim the title of the largest global battery group.
The Chinese company now has a 34% share of the market and supplies batteries to a range of made-in-China vehicles, including the Tesla Model Y, SAIC’s MG4/Mulan, and various Li Auto models.
| Company | Country | 2023 Production (megawatt-hour) | Share of Total Production |
|---|---|---|---|
| CATL | 🇨🇳 China | 242,700 | 34% |
| BYD | 🇨🇳 China | 115,917 | 16% |
| LG Energy Solution | 🇰🇷 Korea | 108,487 | 15% |
| Panasonic | 🇯🇵 Japan | 56,560 | 8% |
| SK On | 🇰🇷 Korea | 40,711 | 6% |
| Samsung SDI | 🇰🇷 Korea | 35,703 | 5% |
| CALB | 🇨🇳 China | 23,493 | 3% |
| Farasis Energy | 🇨🇳 China | 16,527 | 2% |
| Envision AESC | 🇨🇳 China | 8,342 | 1% |
| Sunwoda | 🇨🇳 China | 6,979 | 1% |
| Other | - | 56,040 | 8% |
In 2023, BYD surpassed LG Energy Solution to claim second place. This was driven by demand from its own models and growth in third-party deals, including providing batteries for the made-in-Germany Tesla Model Y, Toyota bZ3, Changan UNI-V, Venucia V-Online, as well as several Haval and FAW models.
The top three battery makers (CATL, BYD, LG) collectively account for two-thirds (66%) of total battery deployment.
Once a leader in the EV battery business, Panasonic now holds the fourth position with an 8% market share, down from 9% last year. With its main client, Tesla, now sourcing batteries from multiple suppliers, the Japanese battery maker seems to be losing its competitive edge in the industry.
Overall, the global EV battery market size is projected to grow from $49 billion in 2022 to $98 billion by 2029, according to Fortune Business Insights.

-

 Debt1 week ago
How Debt-to-GDP Ratios Have Changed Since 2000
-

 Markets2 weeks ago
Ranked: The World’s Top Flight Routes, by Revenue
-

 Countries2 weeks ago
Population Projections: The World’s 6 Largest Countries in 2075
-

 Markets2 weeks ago
The Top 10 States by Real GDP Growth in 2023
-

 Demographics2 weeks ago
The Smallest Gender Wage Gaps in OECD Countries
-

 United States2 weeks ago
Where U.S. Inflation Hit the Hardest in March 2024
-

 Green2 weeks ago
Top Countries By Forest Growth Since 2001
-

 United States2 weeks ago
Ranked: The Largest U.S. Corporations by Number of Employees