Mining
Gold: Off to the Races, or Just Another False Start? [Chart]
![Gold: Off to the Races, or Just Another False Start? [Chart]](https://www.visualcapitalist.com/wp-content/uploads/2015/10/gold-200-day-moving-average-chart.jpg)
Gold: Off to the Races, or Just Another False Start? [Chart]
The Chart of the Week is a weekly Visual Capitalist feature on Fridays.
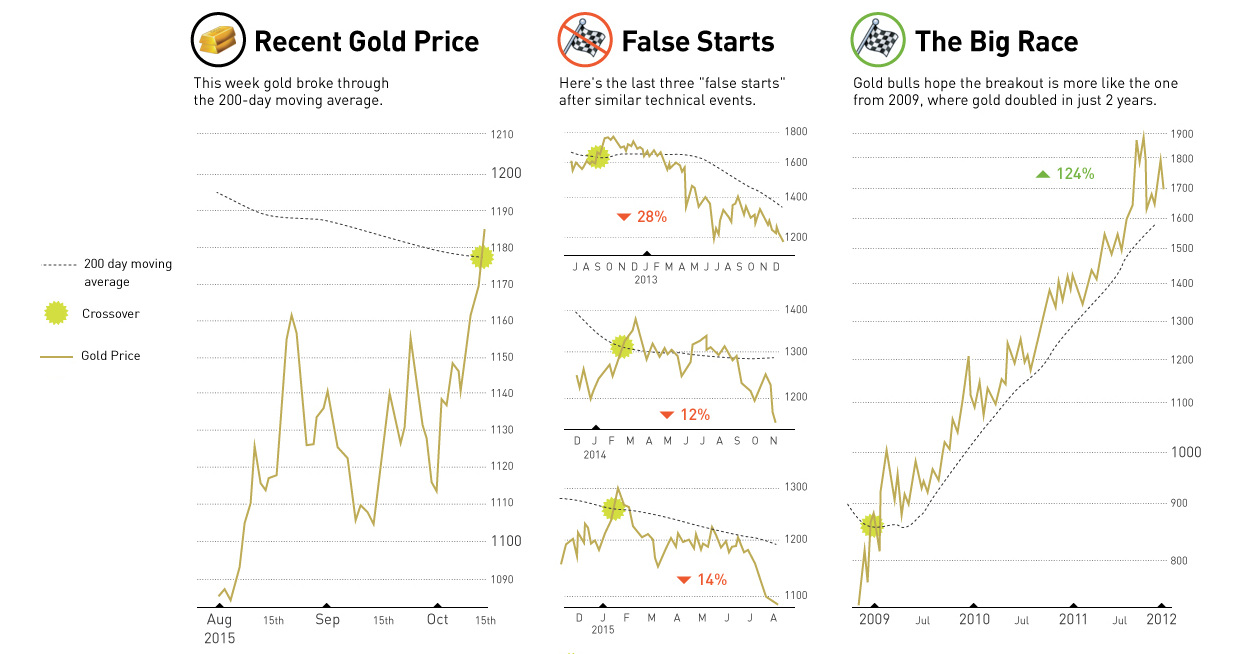
Commodity traders know that gold is highly cyclical, and that it takes significant changes in the fundamentals and sentiment to change the long-term price trend. That said, the latest news on gold is cautiously optimistic for those waiting for a rebound in the precious metal. Over the last few days, gold has broken through its 200-day moving average to reach its highest price in three months at just short of $1,200 per oz.
This type of technical breakthrough is rare: over the last six years, gold has touched its 200-day moving average on the upswing six different times. Each time gold emerged from these technical circumstances, the downward momentum of the gold price would remain unaffected.
The most recent breakthrough was in early 2015, but gold subsequently fell back through its moving average to finish off -14% lower than it started six months earlier. In 2012 and 2014, similar technical breakthroughs also occurred, ending in similar bearish fates.
The subsequent trading was particularly nasty in 2012. After the technical event happened that year, the gold price continued to fall over the course of 16 months by a whopping -28%.
That said, crossing the 200-day moving average is still regarded as an important technical event to traders. If you need proof, look back to gold’s largest run in recent memory, which occurred in the aftermath of the Financial Crisis. Gold crossed its 200-day moving average while it was worth a measly $860/oz and soared 124% in value over the next 32 months. It would reach roughly $1,900 per oz, its highest price (in absolute terms) of all time.
So will crossing the 200-day moving average mean anything this time around? It’s impossible to say, but there is certainly no shortage of other indicators that may suggest that it is time for investors to pile back into gold stocks.


Lithium
Ranked: The Top 10 EV Battery Manufacturers in 2023
Asia dominates this ranking of the world’s largest EV battery manufacturers in 2023.


The Top 10 EV Battery Manufacturers in 2023
This was originally posted on our Voronoi app. Download the app for free on iOS or Android and discover incredible data-driven charts from a variety of trusted sources.
Despite efforts from the U.S. and EU to secure local domestic supply, all major EV battery manufacturers remain based in Asia.
In this graphic we rank the top 10 EV battery manufacturers by total battery deployment (measured in megawatt-hours) in 2023. The data is from EV Volumes.
Chinese Dominance
Contemporary Amperex Technology Co. Limited (CATL) has swiftly risen in less than a decade to claim the title of the largest global battery group.
The Chinese company now has a 34% share of the market and supplies batteries to a range of made-in-China vehicles, including the Tesla Model Y, SAIC’s MG4/Mulan, and various Li Auto models.
| Company | Country | 2023 Production (megawatt-hour) | Share of Total Production |
|---|---|---|---|
| CATL | 🇨🇳 China | 242,700 | 34% |
| BYD | 🇨🇳 China | 115,917 | 16% |
| LG Energy Solution | 🇰🇷 Korea | 108,487 | 15% |
| Panasonic | 🇯🇵 Japan | 56,560 | 8% |
| SK On | 🇰🇷 Korea | 40,711 | 6% |
| Samsung SDI | 🇰🇷 Korea | 35,703 | 5% |
| CALB | 🇨🇳 China | 23,493 | 3% |
| Farasis Energy | 🇨🇳 China | 16,527 | 2% |
| Envision AESC | 🇨🇳 China | 8,342 | 1% |
| Sunwoda | 🇨🇳 China | 6,979 | 1% |
| Other | - | 56,040 | 8% |
In 2023, BYD surpassed LG Energy Solution to claim second place. This was driven by demand from its own models and growth in third-party deals, including providing batteries for the made-in-Germany Tesla Model Y, Toyota bZ3, Changan UNI-V, Venucia V-Online, as well as several Haval and FAW models.
The top three battery makers (CATL, BYD, LG) collectively account for two-thirds (66%) of total battery deployment.
Once a leader in the EV battery business, Panasonic now holds the fourth position with an 8% market share, down from 9% last year. With its main client, Tesla, now sourcing batteries from multiple suppliers, the Japanese battery maker seems to be losing its competitive edge in the industry.
Overall, the global EV battery market size is projected to grow from $49 billion in 2022 to $98 billion by 2029, according to Fortune Business Insights.

-

 Science1 week ago
Visualizing the Average Lifespans of Mammals
-

 Markets2 weeks ago
The Top 10 States by Real GDP Growth in 2023
-

 Demographics2 weeks ago
The Smallest Gender Wage Gaps in OECD Countries
-

 United States2 weeks ago
Where U.S. Inflation Hit the Hardest in March 2024
-

 Green2 weeks ago
Top Countries By Forest Growth Since 2001
-

 United States2 weeks ago
Ranked: The Largest U.S. Corporations by Number of Employees
-

 Maps2 weeks ago
The Largest Earthquakes in the New York Area (1970-2024)
-

 Green2 weeks ago
Ranked: The Countries With the Most Air Pollution in 2023