Energy
The Lithium Revolution
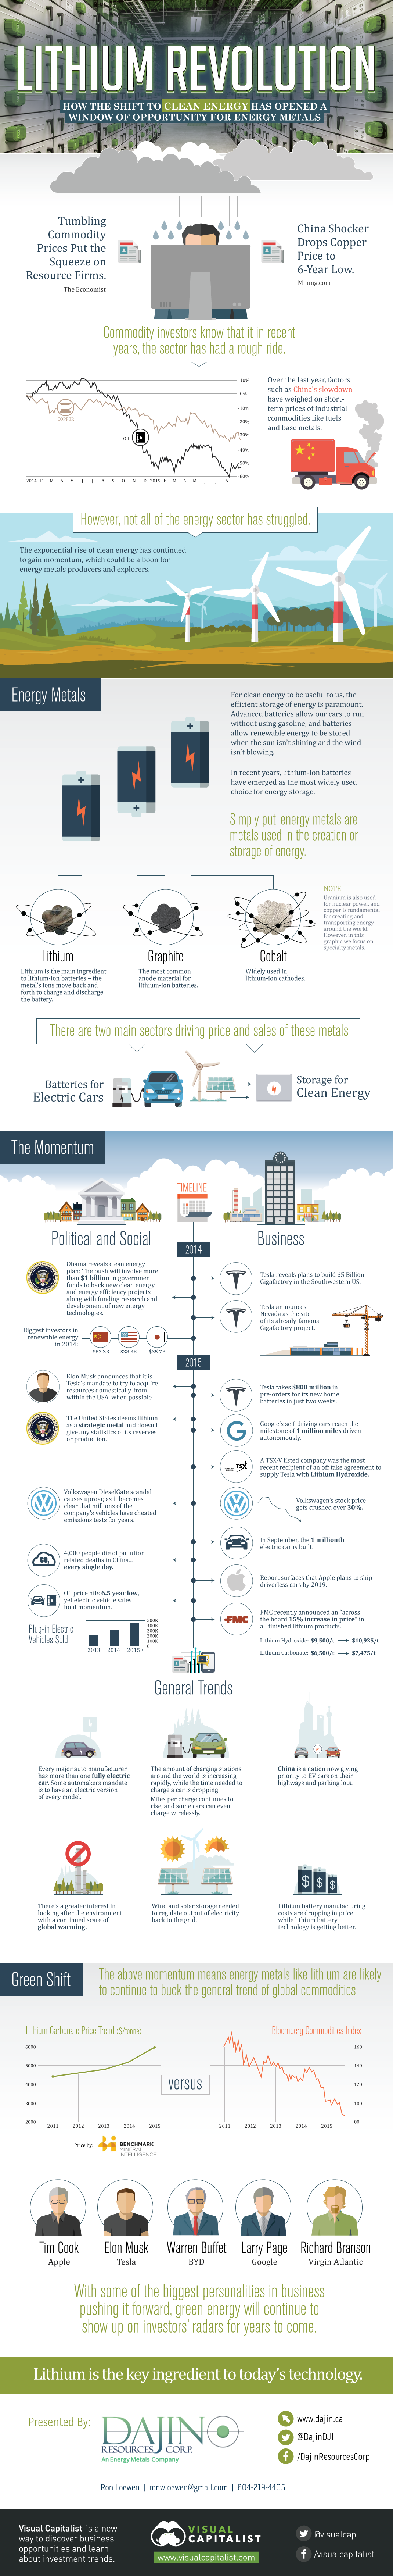
The Lithium Revolution
How the shift to clean energy has opened a window of opportunity for energy metals.
“The Lithium Revolution” infographic presented by: Dajin Resources
Commodity investors know that it in recent years, the sector has had a rough ride. Recently, factors such as China’s slowdown have weighed on short-term prices of industrial commodities like fuels and base metals.
However, not all of the energy sector has struggled. The rise of clean energy has continued to gain momentum, which could be a boon for energy metals producers and explorers.
Energy Metals
Simply put, energy metals are metals used in the creation or storage of energy. Here are some examples of energy metals needed to make lithium-ion batteries, which are the storage mechanism of choice for many green energy producers:
Lithium: Lithium is the main ingredient to lithium-ion batteries – the metal’s ions move back and forth to charge and discharge the battery.
Cobalt: Widely used in lithium-ion cathodes
Graphite: The most common anode material for lithium-ion batteries.
Note: Uranium is also used for nuclear power, and copper is fundamental for creating and transporting energy around the world. However, in this infographic we focus on specialty metals.
Electric cars and energy storage for renewable sources have been driving the increases in price and demand for these sectors. Let’s take a look at the specific momentum that has been growing since 2014.
The Momentum
Political and social:
2014
- Obama reveals clean energy plan: The push will involve more than $1 billion in government funds to back new clean energy and energy efficiency projects along with funding research and development of new energy technologies.
- Who were the biggest investors in renewable energy in 2014?
China ($83.3 billion), USA ($38.3 billion), and Japan ($35.7 billion)
2015
- Volkswagen DieselGate scandal causes uproar, as it becomes clear that millions of the company’s vehicles have cheated emissions tests for years
- Elon Musk announces a mandate for Tesla Motors to acquire raw materials from the USA when possible.
- 4,000 people die, each day, of pollution related deaths in China alone.
- The United States deems lithium as a strategic metal and doesn’t give any statistics of its reserves or production.
Business:
2014
- Tesla reveals plans to build $5 Billion Gigafactory in the Southwestern US.
- Tesla announces Nevada as the site of its already-famous Gigafactory project.
2015
- The 1 millionth electric car is built in September 2015.
- Report surfaces that Apple plans to ship driverless cars by 2019.
- Google’s self-driving cars reach the milestone of 1 million miles driven autonomously.
- Tesla takes $800 million in orders for its new home batteries in just two weeks.
- A TSX-V traded company was the most recent recipient of an off take agreement to supply Tesla with Lithium Hydroxide.
- Volkswagen’s stock price gets crushed over 30% in the aftermath of DieselGate.
- FMC recently announced an “across the board 15% increase in price” in all finished lithium products. Lithium Hydroxide rose from $9,500 per ton, up to $10,870. Lithium Carbonate from $6,500 per ton up to $7,475 USD.
General Trends:
- Charging stations have increased rapidly around the world.
- Every major auto manufacture has more than one fully electric car. Some automakers mandate is to have an electric version of every model.
- The oil price has hit a 6.5 year low, yet electric vehicle sales have held momentum.
- Lithium battery manufacturing costs are dropping in price while lithium battery technology is getting better.
- New technology is decreasing the charge time for electric cars. Meanwhile, “miles per charge” is rising, and some cars can even recharge wirelessly.
- There’s a greater interest in looking after the environment with a continued scare of global warming.
- Wind and solar storage needed to regulate output of electricity back to the grid.
- China is a nation now giving priority to EV cars on their highways and parking lots.
Green Shift
The above momentum means energy metals like lithium could continue to buck the general trend of global commodities. So far, the price of lithium has increased steadily since 2011.


Energy
Charted: 4 Reasons Why Lithium Could Be the Next Gold Rush
Visual Capitalist has partnered with EnergyX to show why drops in prices and growing demand may make now the right time to invest in lithium.


4 Reasons Why You Should Invest in Lithium
Lithium’s importance in powering EVs makes it a linchpin of the clean energy transition and one of the world’s most precious minerals.
In this graphic, Visual Capitalist partnered with EnergyX to explore why now may be the time to invest in lithium.
1. Lithium Prices Have Dropped
One of the most critical aspects of evaluating an investment is ensuring that the asset’s value is higher than its price would indicate. Lithium is integral to powering EVs, and, prices have fallen fast over the last year:
| Date | LiOH·H₂O* | Li₂CO₃** |
|---|---|---|
| Feb 2023 | $76 | $71 |
| March 2023 | $71 | $61 |
| Apr 2023 | $43 | $33 |
| May 2023 | $43 | $33 |
| June 2023 | $47 | $45 |
| July 2023 | $44 | $40 |
| Aug 2023 | $35 | $35 |
| Sept 2023 | $28 | $27 |
| Oct 2023 | $24 | $23 |
| Nov 2023 | $21 | $21 |
| Dec 2023 | $17 | $16 |
| Jan 2024 | $14 | $15 |
| Feb 2024 | $13 | $14 |
Note: Monthly spot prices were taken as close to the 14th of each month as possible.
*Lithium hydroxide monohydrate MB-LI-0033
**Lithium carbonate MB-LI-0029
2. Lithium-Ion Battery Prices Are Also Falling
The drop in lithium prices is just one reason to invest in the metal. Increasing economies of scale, coupled with low commodity prices, have caused the cost of lithium-ion batteries to drop significantly as well.
In fact, BNEF reports that between 2013 and 2023, the price of a Li-ion battery dropped by 82%.
| Year | Price per KWh |
|---|---|
| 2023 | $139 |
| 2022 | $161 |
| 2021 | $150 |
| 2020 | $160 |
| 2019 | $183 |
| 2018 | $211 |
| 2017 | $258 |
| 2016 | $345 |
| 2015 | $448 |
| 2014 | $692 |
| 2013 | $780 |

3. EV Adoption is Sustainable
One of the best reasons to invest in lithium is that EVs, one of the main drivers behind the demand for lithium, have reached a price point similar to that of traditional vehicle.
According to the Kelly Blue Book, Tesla’s average transaction price dropped by 25% between 2022 and 2023, bringing it in line with many other major manufacturers and showing that EVs are a realistic transport option from a consumer price perspective.
| Manufacturer | September 2022 | September 2023 |
|---|---|---|
| BMW | $69,000 | $72,000 |
| Ford | $54,000 | $56,000 |
| Volkswagon | $54,000 | $56,000 |
| General Motors | $52,000 | $53,000 |
| Tesla | $68,000 | $51,000 |
4. Electricity Demand in Transport is Growing
As EVs become an accessible transport option, there’s an investment opportunity in lithium. But possibly the best reason to invest in lithium is that the IEA reports global demand for the electricity in transport could grow dramatically by 2030:
| Transport Type | 2022 | 2025 | 2030 |
|---|---|---|---|
| Buses 🚌 | 23,000 GWh | 50,000 GWh | 130,000 GWh |
| Cars 🚙 | 65,000 GWh | 200,000 GWh | 570,000 GWh |
| Trucks 🛻 | 4,000 GWh | 15,000 GWh | 94,000 GWh |
| Vans 🚐 | 6,000 GWh | 16,000 GWh | 72,000 GWh |
The Lithium Investment Opportunity
Lithium presents a potentially classic investment opportunity. Lithium and battery prices have dropped significantly, and recently, EVs have reached a price point similar to other vehicles. By 2030, the demand for clean energy, especially in transport, will grow dramatically.
With prices dropping and demand skyrocketing, now is the time to invest in lithium.
EnergyX is poised to exploit lithium demand with cutting-edge lithium extraction technology capable of extracting 300% more lithium than current processes.

-

 Lithium2 days ago
Ranked: The Top 10 EV Battery Manufacturers in 2023
Asia dominates this ranking of the world’s largest EV battery manufacturers in 2023.
-

 Energy7 days ago
The World’s Biggest Nuclear Energy Producers
China has grown its nuclear capacity over the last decade, now ranking second on the list of top nuclear energy producers.
-

 Energy4 weeks ago
The World’s Biggest Oil Producers in 2023
Just three countries accounted for 40% of global oil production last year.
-

 Energy1 month ago
How Much Does the U.S. Depend on Russian Uranium?
Currently, Russia is the largest foreign supplier of nuclear power fuel to the U.S.
-

 Uranium2 months ago
Charted: Global Uranium Reserves, by Country
We visualize the distribution of the world’s uranium reserves by country, with 3 countries accounting for more than half of total reserves.
-

 Energy2 months ago
Visualizing the Rise of the U.S. as Top Crude Oil Producer
Over the last decade, the United States has established itself as the world’s top producer of crude oil, surpassing Saudi Arabia and Russia.


-

 Green1 week ago
Ranked: The Countries With the Most Air Pollution in 2023
-

 Misc2 weeks ago
Almost Every EV Stock is Down After Q1 2024
-

 AI2 weeks ago
The Stock Performance of U.S. Chipmakers So Far in 2024
-

 Markets2 weeks ago
Charted: Big Four Market Share by S&P 500 Audits
-

 Real Estate2 weeks ago
Ranked: The Most Valuable Housing Markets in America
-

 Money2 weeks ago
Which States Have the Highest Minimum Wage in America?
-

 AI2 weeks ago
Ranked: Semiconductor Companies by Industry Revenue Share
-

 Travel2 weeks ago
Ranked: The World’s Top Flight Routes, by Revenue