Mining
It’s Time to Pile Back Into Gold Stocks [Charts]
The blessing and curse of being a contrarian is this: an inevitable outcome is recognized well before it comes to fruition. Even though profitable opportunities may be identified well in advance, it can take so long for hallmark events such as capitulation to happen, that it gives ample time to second guess one’s convictions.
We’ve believed, even before the correction that has recently hit U.S. markets, that the bear market for gold was long in the tooth. With asset bubbles all over the place, it has seemed for awhile that gold and silver were the only assets that were reasonably priced. Then yesterday, our friends at Palisade Capital sent us over five charts on why they believe that gold stocks are the most undervalued that they have been in decades.
We tend to agree with that sentiment, which is why in last week’s chart of the week we predicted that gold had already bottomed and that it had nowhere to go but up. (We further predicted that other commodities such as base metals would continue to get routed for the time being, and that U.S. equities would not return to the same levels for awhile.)
In any case, here are the charts:
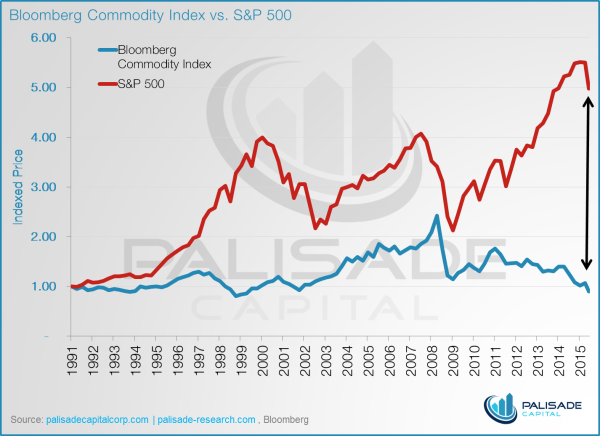
1. The divergence between the S&P 500 and Bloomberg Commodity Index is at an all-time high.
2. The bear market in the TSX Venture now stands at 1,090+ days.
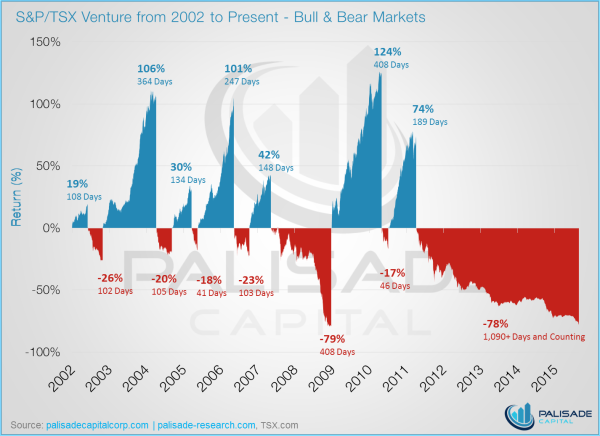
The TSX Venture, the Canadian home to the majority of the world’s junior mining stocks, is still plagued with plenty of zombie stocks that amount to billions of dollars of negative working capital. The exchange and regulators have also been readily criticized for recent changes that limit access to capital from retail investors. However, in spite of all of this, there are truly some great projects and assets lying in some of the companies that have survived the onslaught. As you’ll see in the next chart, these companies have never been more undervalued.
3. Gold stocks have never been this cheap relative to the price of gold.
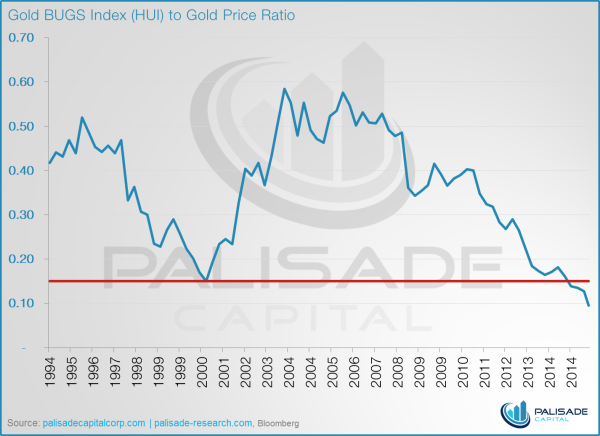
The Gold BUGS Index (HUI), which tracks the world’s largest gold miners, was last this low when gold was only $250/oz.
4. The gold bear market is closing in on being the longest in BGMI history.
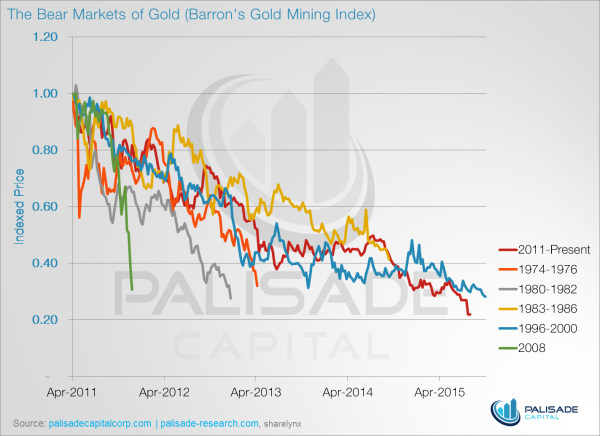
Using the Barron’s Gold Mining Index (BGMI), this is already the worst bear market for gold miners. However, in just a couple of months, it will also surpass the 1996-2000 bear market as the longest.
5. The ratio between the gold/silver sector to the S&P 500 is unprecedented.
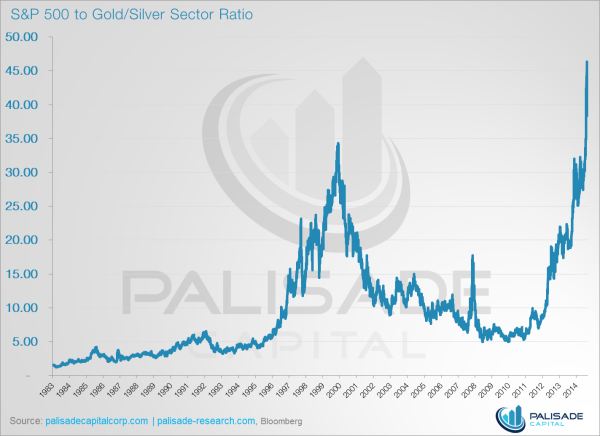
When pricing the S&P 500 in terms of the Gold/Silver Sector Index (XAU), it has never been this expensive. Put another way: gold and silver has never been this cheap.
Chart credit to: Palisade Research and The Daily Gold


Copper
Brass Rods: The Secure Choice
This graphic shows why brass rods are the secure choice for precision-machined and forged parts.


Brass Rods: The Secure Choice
The unique combination of machinability and recyclability makes brass rods the secure choice for manufacturers seeking future-proof raw material solutions.
This infographic, from the Copper Development Association, shows three ways brass rods give manufacturers greater control and a license to grow in the competitive market for precision-machined and forged products.
Future-Proof Investments in New Machine Tools
A material’s machinability directly impacts machine throughput, which typically has the largest impact on machine shop profitability.
The high-speed machining capabilities of brass rods maximize machine tool performance, allowing manufacturers to run the material faster and longer without sacrificing tool life, chip formation, or surface quality.
The high machining efficiency of brass leads to reduced per-part costs, quicker return on investment (ROI) for new machine tools, and expanded production capacity for new projects.
Supply Security Through Closed Loop Recycling
Brass, like its parent element copper, can be infinitely recycled.
In 2022, brass- and wire-rod mills accounted for the majority of the 830,000 tonnes of copper recycled from scrap in the United States.
Given that scrap ratios for machined parts typically range from 60-70% by weight, producing mills benefit from a secure and steady supply of clean scrap returned directly from customers, which is recycled to create new brass rods.
The high residual value of brass scrap creates a strong recycling incentive. Scrap buy back programs give manufacturers greater control over raw material net costs as scrap value is often factored into supplier purchase agreements.
Next Generation Alloys for a Lead-Free Future
Increasingly stringent global regulations continue to pressure manufacturers to minimize the use of materials containing trace amounts of lead and other harmful impurities.
The latest generation of brass-rod alloys is engineered to meet the most demanding criteria for lead leaching in drinking water and other sensitive applications.
Seven brass-rod alloys passed rigorous testing to become the only ‘Acceptable Materials’ against lower lead leaching criteria recently adopted in the national U.S. drinking water quality standard, NSF 61.
Learn more about the advantages of brass rods solutions.

-

 Base Metals1 year ago
Ranked: The World’s Largest Copper Producers
Many new technologies critical to the energy transition rely on copper. Here are the world’s largest copper producers.
-

 Silver2 years ago
Mapped: Solar Power by Country in 2021
In 2020, solar power saw its largest-ever annual capacity expansion at 127 gigawatts. Here’s a snapshot of solar power capacity by country.
-

 Batteries5 years ago
Visualizing Copper’s Role in the Transition to Clean Energy
A clean energy transition is underway as wind, solar, and batteries take center stage. Here’s how copper plays the critical role in these technologies.
-

 Science5 years ago
Everything You Need to Know on VMS Deposits
Deep below the ocean’s waves, VMS deposits spew out massive amounts of minerals like copper, zinc, and gold, making them a key source of the metals…
-
 Copper5 years ago
How Much Copper is in an Electric Vehicle?
Have you ever wondered how much copper is in an electric vehicle? This infographic shows the metal’s properties as well as the quantity of copper used.
-
 Copper6 years ago
Copper: Driving the Green Energy Revolution
Renewable energy is set to fuel a new era of copper demand – here’s how much copper is used in green applications from EVs to photovoltaics.


-

 Markets2 weeks ago
Visualizing America’s Shortage of Affordable Homes
-

 Technology1 week ago
Ranked: Semiconductor Companies by Industry Revenue Share
-

 Money2 weeks ago
Which States Have the Highest Minimum Wage in America?
-

 Real Estate2 weeks ago
Ranked: The Most Valuable Housing Markets in America
-

 Markets2 weeks ago
Charted: Big Four Market Share by S&P 500 Audits
-

 AI2 weeks ago
The Stock Performance of U.S. Chipmakers So Far in 2024
-

 Misc2 weeks ago
Almost Every EV Stock is Down After Q1 2024
-

 Money2 weeks ago
Where Does One U.S. Tax Dollar Go?