Mining
The Story of Voisey’s Bay: The Auction (Part 2 of 3)


The Story of Voisey’s Bay: The Auction (Part 2 of 3)
Presented by: Equitas Resources, “Nickel exploration in Labrador”
Preface
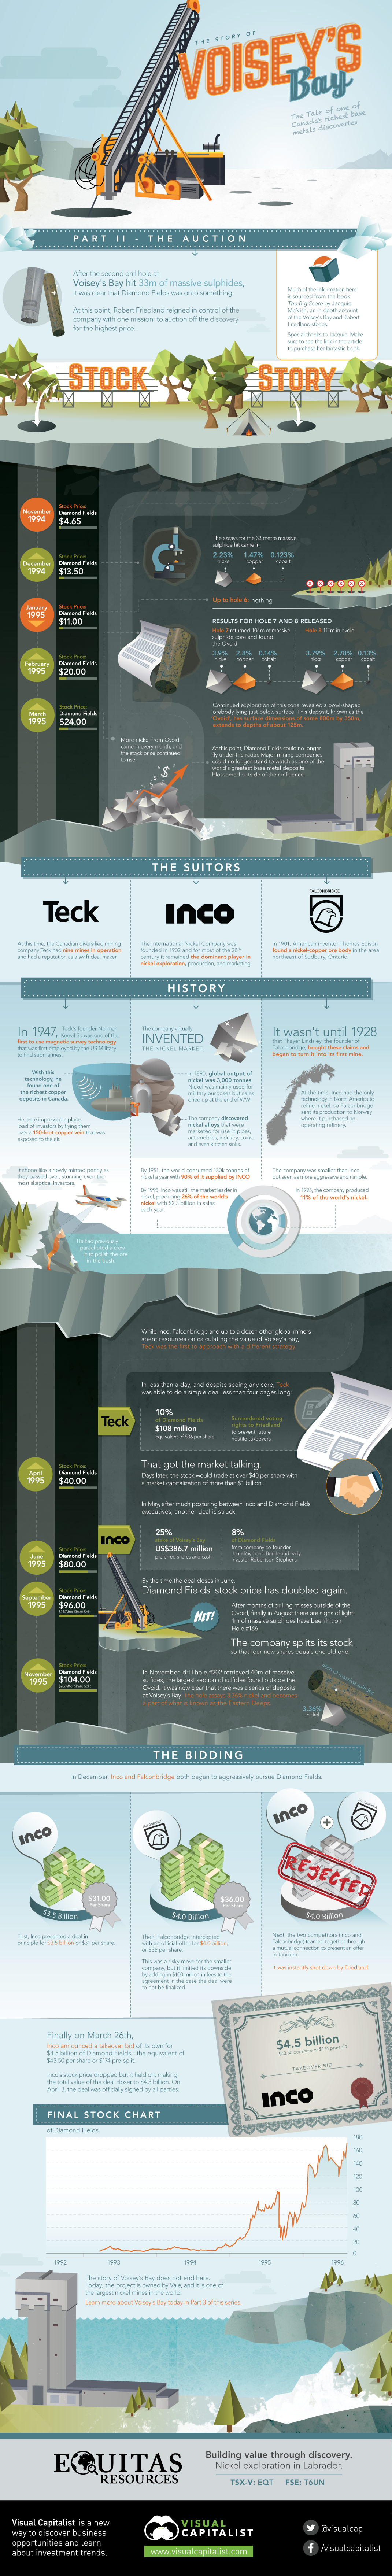
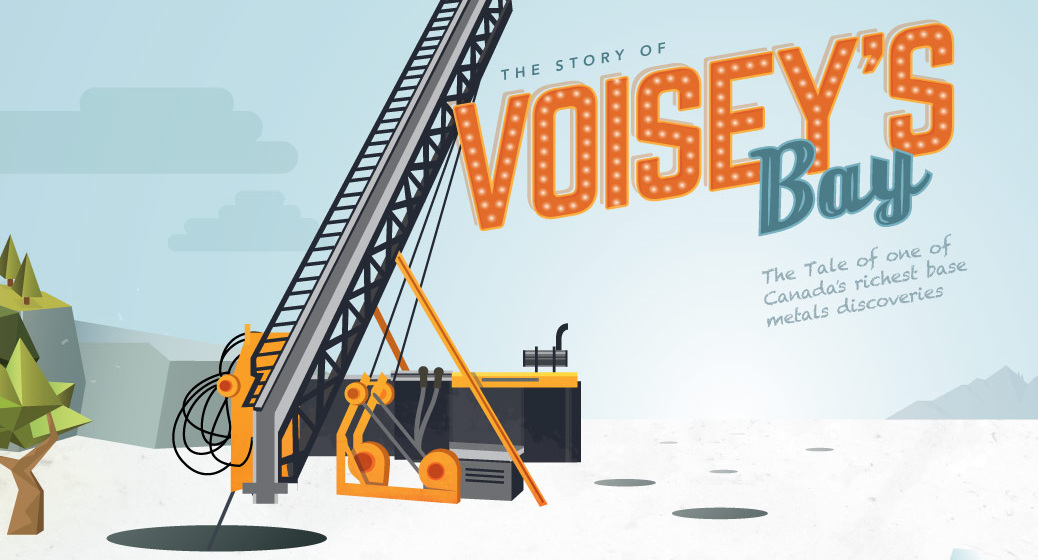
The hit at diamond drill hole #2 of 33m of massive sulphides turned Voisey’s Bay from caribou pasture to one of the most exciting stories in the mining world. For a full recap of the events leading to this point, check out Part 1 of the Voisey’s Bay story.
In Part 2 of this series, we look at the ensuing bidding war that occurred once it was clear that Voisey’s Bay had all of the action. Again, we have turned to Jacquie McNish’s fabulous book The Big Score, which documents the history of the discovery, biographical elements of Robert Friedland’s life, and the ensuing bidding war between Inco and Falconbridge that led to one of the most spectacular takeovers in mining history. If you like these infographics, then look into buying Jacquie’s book. It was gripping and full of information.
Setting the Stage
The discovery of massive sulphides with Hole #2 brought increased attention to the former diamond play. However, the stock price didn’t really explode until the assays came in: 2.23% nickel, 1.47% copper, and 0.123% cobalt. Diamond Fields now traded in December 1994 at $13.50 per share, up from $4.65 just a month prior.
The company doubled down on drilling, and up until January 1995 they had hit nothing after Hole #2. The price dribbled down to $11.00.
However, it was in February 1995 that the results for Holes #7 and #8 were released, and they were some of the most significant holes for the entire project. The holes were in the Ovoid, which would soon be a famed and ultra-high rich section of the Voisey’s Bay discovery.
Hole #7 was 104m long and had 3.9% nickel, 2.8% copper, and 0.14% cobalt. Hole #8 was 111m long and had 3.7% nickel, 2.78% copper, and 0.13% cobalt. This propelled the stock price to $20.00 in February 1995.
Continued exploration of the Ovoid revealed a bowl-shaped orebody lying just below surface. This deposit had surface dimensions of some 800m by 350m, and extended to depths of about 125m. More nickel from Ovoid came in every month, and the stock price continued to rise.
At this point, Diamond Fields could no longer fly under the radar. Major mining couldn’t stand to watch as one of the world’s greatest base metal deposits blossomed outside of their influence.
The Suitors
Three major mining companies vied to get in on the action. Here’s some history on each of them:
Teck
At this time, the Canadian diversified mining company Teck had nine mines in operation and had a reputation as a swift deal maker.
- In 1947, Teck’s founder Norman Keevil Sr. was one of the first to use magnetic survey technology that was first employed by the US Military to find submarines. With this technology, he found one of the richest copper deposits in Canada.
- He once impressed a plane load of investors by flying them over a 150-foot copper vein that was exposed to the air. It shone like a newly minted penny as they passed over, stunning even the most skeptical investors. (He had previously parachuted a crew in to polish the ore in the bush.)
Inco
The International Nickel Company was founded in 1902 and for most of the 20th century it remained the dominant player in nickel exploration, production, and marketing.
The company virtually invented the nickel market:
- In 1890, global output of nickel was 3,000 tonnes
- Nickel was mainly used for military purposes but sales dried up at the end of WWI
- The company discovered nickel alloys that were marketed for use in automobiles, pipes, industry, coins, and even kitchen sinks
- By 1951, the world consumed 130,000 tonnes of nickel a year with 90% of it supplied by Inco
By 1995, Inco was still the market leader in nickel, producing 26% of the world’s nickel with $2.3 billion in sales each year.
Falconbridge
In 1901, American inventor Thomas Edison found a nickel-copper ore body in the area northeast of Sudbury, Ontario.
However, it wasn’t until 1928 that Thayer Lindsley, the founder of Falconbridge, bought these claims and began to turn it into its first mine.
At the time, Inco had the only technology in North America to refine nickel, so Falconbridge sent its production to Norway where it purchased an operating refinery.
The company was smaller than Inco, but seen as more aggressive and nimble. The company produced 11% of the world’s nickel in 1995.
The Bidding Begins
While Inco, Falconbridge and up to a dozen other global miners spent resources on calculating the value of Voisey’s Bay, Teck was the first to approach with a different strategy.
In less than a day, and despite seeing any core, Teck was able to do a simple deal less than four pages long: $108 million for 10% of the company, or the equivalent of $36 per share. Teck also surrendered their voting rights to Friedland to prevent future hostile takeovers.
That got the market talking. Days later, the stock would trade at over $40 per share with a market capitalization of more than $1 billion.
In May 1995, after much posturing between Inco and Diamond Fields executives, another deal was struck. This time, Inco bought a 25% stake of Voisey’s Bay for US$386.7 million in preferred shares and cash, as well as 8% of Diamond Fields from company co-founder Jean-Raymond Boulle and early investor Robertson Stephens.
By the time the deal closed in June 1995, Diamond Fields’ stock price doubled again to $80.00.
After months of drilling misses outside of the Ovoid, finally in August there were signs of light: 1m of massive sulphides were hit on Hole #166.
In November, drill hole #202 retrieved 40m of massive sulfides, the largest section of sulfides found outside the Ovoid. It was now clear that there was a series of deposits at Voisey’s Bay. The hole assayed 3.36% nickel and became a part of what is known as the Eastern Deeps.
The Showdown
In December, Inco and Falconbridge both began to aggressively pursue Diamond Fields.
First, Inco presented a deal in principle for $3.5 billion, or $31 per share. Then, Falconbridge intercepted with an official offer for $4.0 billion, or $36 per share. This was a risky move for the smaller company, but it limited its downside by adding in $100 million in fees to the agreement in the case the deal were to not be finalized.
Next, the two competitors (Inco and Falconbridge) teamed together through a mutual connection to present an offer in tandem.
It was instantly shot down by Friedland.
Finally on March 26th 1996, Inco announced a takeover bid of its own for $4.5 billion of Diamond Fields – the equivalent of $43.50 per share or $174 pre-split. Inco’s stock price dropped but it held on, making the total value of the deal closer to $4.3 billion. On April 3, the deal was officially signed by all parties.


Lithium
Ranked: The Top 10 EV Battery Manufacturers in 2023
Asia dominates this ranking of the world’s largest EV battery manufacturers in 2023.


The Top 10 EV Battery Manufacturers in 2023
This was originally posted on our Voronoi app. Download the app for free on iOS or Android and discover incredible data-driven charts from a variety of trusted sources.
Despite efforts from the U.S. and EU to secure local domestic supply, all major EV battery manufacturers remain based in Asia.
In this graphic we rank the top 10 EV battery manufacturers by total battery deployment (measured in megawatt-hours) in 2023. The data is from EV Volumes.
Chinese Dominance
Contemporary Amperex Technology Co. Limited (CATL) has swiftly risen in less than a decade to claim the title of the largest global battery group.
The Chinese company now has a 34% share of the market and supplies batteries to a range of made-in-China vehicles, including the Tesla Model Y, SAIC’s MG4/Mulan, and various Li Auto models.
| Company | Country | 2023 Production (megawatt-hour) | Share of Total Production |
|---|---|---|---|
| CATL | 🇨🇳 China | 242,700 | 34% |
| BYD | 🇨🇳 China | 115,917 | 16% |
| LG Energy Solution | 🇰🇷 Korea | 108,487 | 15% |
| Panasonic | 🇯🇵 Japan | 56,560 | 8% |
| SK On | 🇰🇷 Korea | 40,711 | 6% |
| Samsung SDI | 🇰🇷 Korea | 35,703 | 5% |
| CALB | 🇨🇳 China | 23,493 | 3% |
| Farasis Energy | 🇨🇳 China | 16,527 | 2% |
| Envision AESC | 🇨🇳 China | 8,342 | 1% |
| Sunwoda | 🇨🇳 China | 6,979 | 1% |
| Other | - | 56,040 | 8% |
In 2023, BYD surpassed LG Energy Solution to claim second place. This was driven by demand from its own models and growth in third-party deals, including providing batteries for the made-in-Germany Tesla Model Y, Toyota bZ3, Changan UNI-V, Venucia V-Online, as well as several Haval and FAW models.
The top three battery makers (CATL, BYD, LG) collectively account for two-thirds (66%) of total battery deployment.
Once a leader in the EV battery business, Panasonic now holds the fourth position with an 8% market share, down from 9% last year. With its main client, Tesla, now sourcing batteries from multiple suppliers, the Japanese battery maker seems to be losing its competitive edge in the industry.
Overall, the global EV battery market size is projected to grow from $49 billion in 2022 to $98 billion by 2029, according to Fortune Business Insights.

-

 Debt1 week ago
How Debt-to-GDP Ratios Have Changed Since 2000
-

 Markets2 weeks ago
Ranked: The World’s Top Flight Routes, by Revenue
-

 Countries2 weeks ago
Population Projections: The World’s 6 Largest Countries in 2075
-

 Markets2 weeks ago
The Top 10 States by Real GDP Growth in 2023
-

 Demographics2 weeks ago
The Smallest Gender Wage Gaps in OECD Countries
-

 United States2 weeks ago
Where U.S. Inflation Hit the Hardest in March 2024
-

 Green2 weeks ago
Top Countries By Forest Growth Since 2001
-

 United States2 weeks ago
Ranked: The Largest U.S. Corporations by Number of Employees