Mining
The World’s Most Valuable Substances by Weight
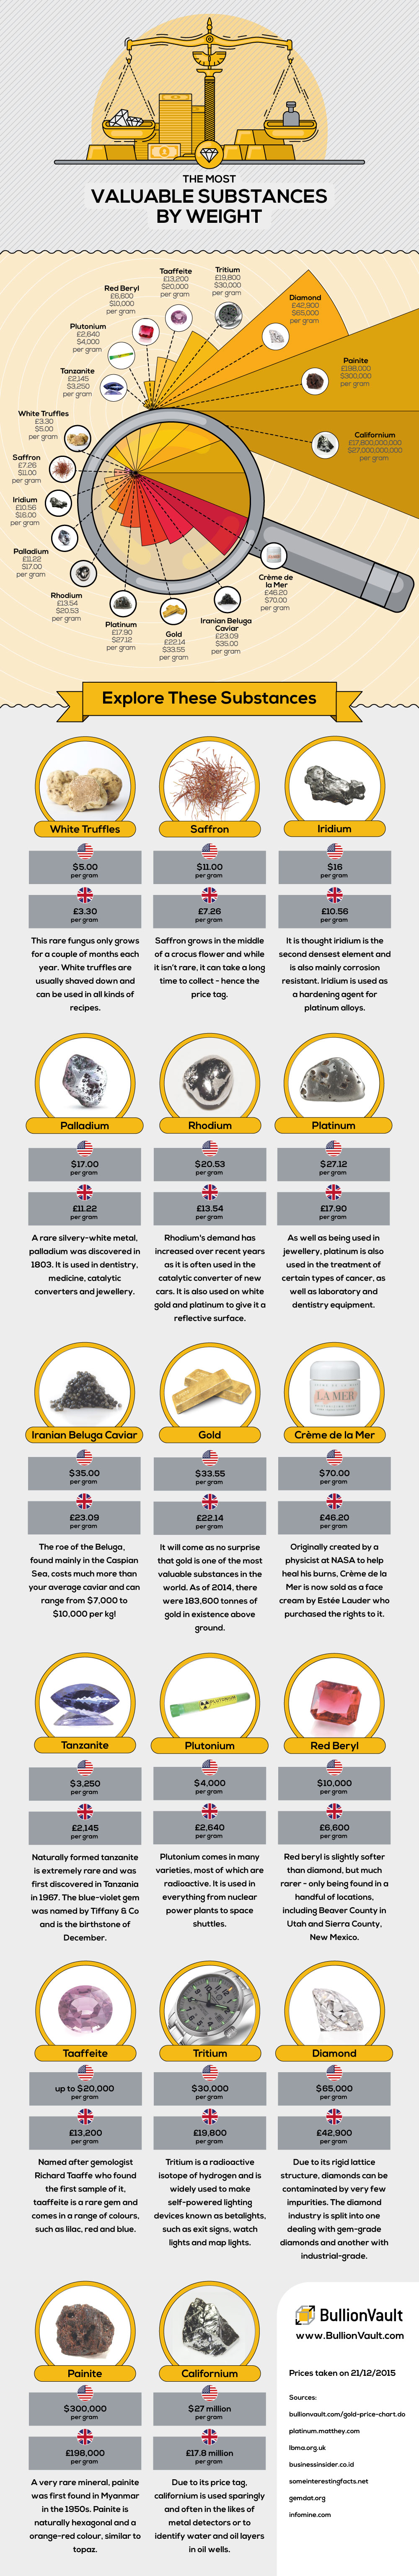
The World’s Most Valuable Substances by Weight
In the field of economics, the laws of supply and demand state that the price of a product and its available supply to the market are interconnected. For example, if a good such as crude oil is produced in excess, the price will drop accordingly.
However, sometimes substances are nearly impossible to produce in the first place – and that means that it can be extremely difficult for the market to respond to increases in demand. The world’s most valuable substances generally fall into this category, and this makes their value per gram very high.
White truffles, for instance, only grow for a couple of months of the year almost exclusively from one part of Italy. They must be foraged by special pigs, and they seem to be worth more every year. The price per gram for white truffles is $5, which means that a pound costs close to $2,000.
Despite this, white truffles barely crack the list of the most valuable substances by weight.
Saffron, a spice that is gathered from the flower of the crocus sativus plant, is another notch higher on the spectrum. To get one pound of dry saffron requires the harvest of 50,000 to 75,000 flowers. There’s only 300 tonnes of production each year, and that annual production is worth around $3 billion.
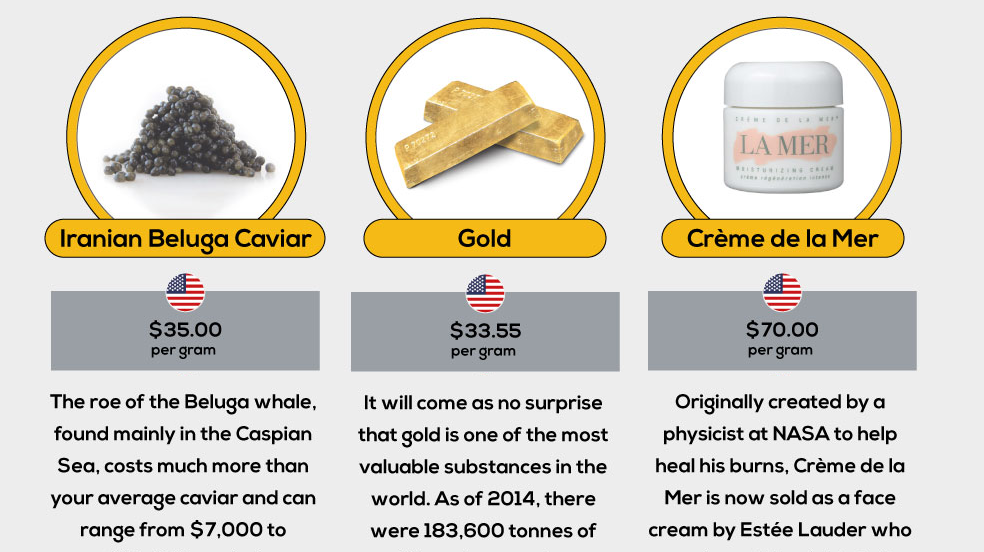
Higher up on the list of the world’s most valuable substances are some familiar metals. Silver does not make the list, as it is only worth around $0.50 per gram. However, many of the platinum group metals (PGMs) do make the list: platinum, palladium, rhodium, and iridium all range between $16 to $27 per gram. Gold also makes the list, and it has traded for more than an ounce of platinum since early 2015. One gram of gold is worth just under $34 per gram.
At the top of the list we find a combination of extremely rare metals, radioactive isotopes, and gemstones.
The radioactive element Californium, first made in 1950, is the most valuable at $27 million per gram. It is one of the few transuranium elements that have practical applications, being used in microscopic amounts for metal detectors and in identifying oil and water layers in oil wells.
Diamonds are near the top of the list as well at $65,000 per gram, though like many other gemstones, the value depends on the specific crystal in question. Many industrial diamonds are relatively cheap, but the rarest and most beautiful stones can be worth millions.
Iranian beluga caviar and Crème de la Mer are the most expensive non-metals or non-gemstones on the list. Iranian caviar is made from the roe of beluga sturgeons found in the Caspian Sea, and it is valued at about $35 per gram. Crème de la Mer was originally created by a physicist for NASA to heal his burns, but it is now sold as a face cream by Estée Lauder for $70 per gram.
Original graphic by: BullionVault


Copper
Brass Rods: The Secure Choice
This graphic shows why brass rods are the secure choice for precision-machined and forged parts.


Brass Rods: The Secure Choice
The unique combination of machinability and recyclability makes brass rods the secure choice for manufacturers seeking future-proof raw material solutions.
This infographic, from the Copper Development Association, shows three ways brass rods give manufacturers greater control and a license to grow in the competitive market for precision-machined and forged products.
Future-Proof Investments in New Machine Tools
A material’s machinability directly impacts machine throughput, which typically has the largest impact on machine shop profitability.
The high-speed machining capabilities of brass rods maximize machine tool performance, allowing manufacturers to run the material faster and longer without sacrificing tool life, chip formation, or surface quality.
The high machining efficiency of brass leads to reduced per-part costs, quicker return on investment (ROI) for new machine tools, and expanded production capacity for new projects.
Supply Security Through Closed Loop Recycling
Brass, like its parent element copper, can be infinitely recycled.
In 2022, brass- and wire-rod mills accounted for the majority of the 830,000 tonnes of copper recycled from scrap in the United States.
Given that scrap ratios for machined parts typically range from 60-70% by weight, producing mills benefit from a secure and steady supply of clean scrap returned directly from customers, which is recycled to create new brass rods.
The high residual value of brass scrap creates a strong recycling incentive. Scrap buy back programs give manufacturers greater control over raw material net costs as scrap value is often factored into supplier purchase agreements.
Next Generation Alloys for a Lead-Free Future
Increasingly stringent global regulations continue to pressure manufacturers to minimize the use of materials containing trace amounts of lead and other harmful impurities.
The latest generation of brass-rod alloys is engineered to meet the most demanding criteria for lead leaching in drinking water and other sensitive applications.
Seven brass-rod alloys passed rigorous testing to become the only ‘Acceptable Materials’ against lower lead leaching criteria recently adopted in the national U.S. drinking water quality standard, NSF 61.
Learn more about the advantages of brass rods solutions.

-

 Base Metals1 year ago
Ranked: The World’s Largest Copper Producers
Many new technologies critical to the energy transition rely on copper. Here are the world’s largest copper producers.
-

 Silver2 years ago
Mapped: Solar Power by Country in 2021
In 2020, solar power saw its largest-ever annual capacity expansion at 127 gigawatts. Here’s a snapshot of solar power capacity by country.
-

 Batteries5 years ago
Visualizing Copper’s Role in the Transition to Clean Energy
A clean energy transition is underway as wind, solar, and batteries take center stage. Here’s how copper plays the critical role in these technologies.
-

 Science5 years ago
Everything You Need to Know on VMS Deposits
Deep below the ocean’s waves, VMS deposits spew out massive amounts of minerals like copper, zinc, and gold, making them a key source of the metals…
-
 Copper5 years ago
How Much Copper is in an Electric Vehicle?
Have you ever wondered how much copper is in an electric vehicle? This infographic shows the metal’s properties as well as the quantity of copper used.
-
 Copper6 years ago
Copper: Driving the Green Energy Revolution
Renewable energy is set to fuel a new era of copper demand – here’s how much copper is used in green applications from EVs to photovoltaics.


-

 Real Estate2 weeks ago
Visualizing America’s Shortage of Affordable Homes
-

 Technology1 week ago
Ranked: Semiconductor Companies by Industry Revenue Share
-

 Money1 week ago
Which States Have the Highest Minimum Wage in America?
-

 Real Estate1 week ago
Ranked: The Most Valuable Housing Markets in America
-

 Business2 weeks ago
Charted: Big Four Market Share by S&P 500 Audits
-

 AI2 weeks ago
The Stock Performance of U.S. Chipmakers So Far in 2024
-

 Misc2 weeks ago
Almost Every EV Stock is Down After Q1 2024
-

 Money2 weeks ago
Where Does One U.S. Tax Dollar Go?