Energy
The Evolution of America’s Energy Supply (1776 – 2014)
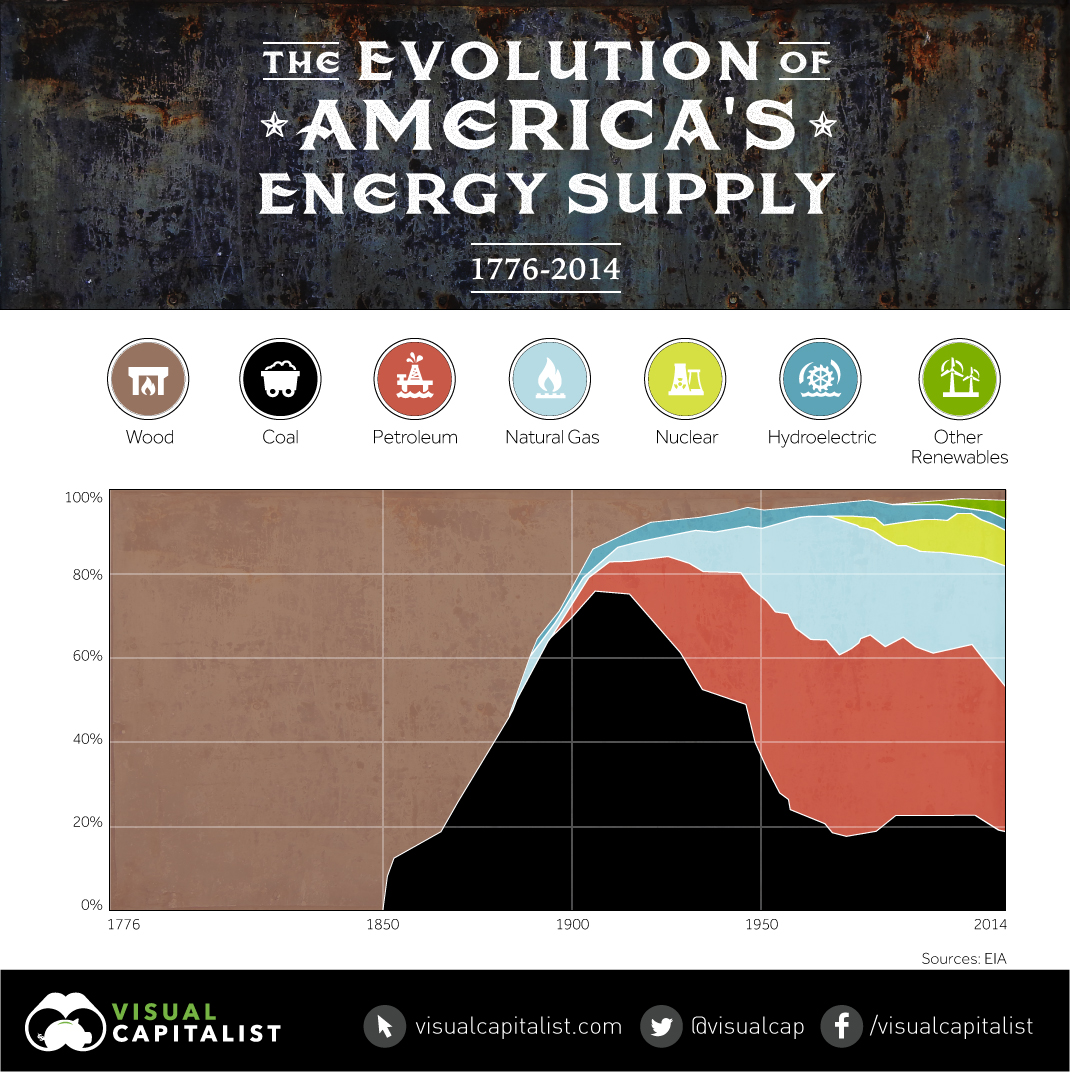
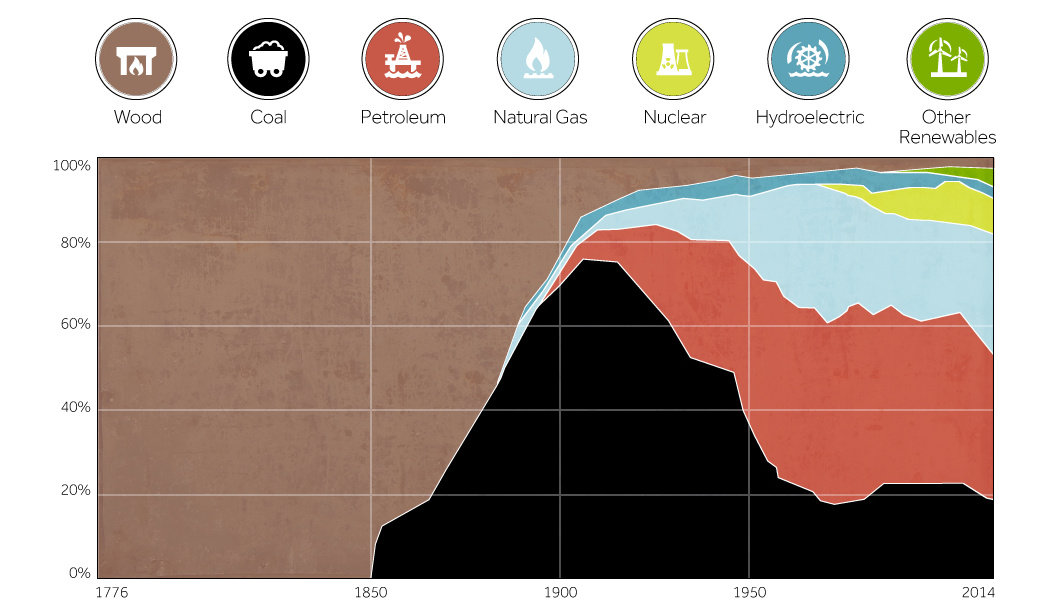
The Evolution of America’s Energy Supply (1776 – 2014)
The Energy Information Administration (EIA) recently released data on the history of America’s energy supply, sorted by the share of each energy source. We’ve taken that data to create the chart associated with today’s post.
Related Topic: Mapping Every Power Plant in the United States
The early settlers to North America relied on organic materials on the surface of land for the vast majority of their energy needs. Wood, brush, and other biomass fuels were burned to warm homes, and eventually to power steam engines. Small amounts of coal were found in riverbeds and other such outcrops, but only local homes in the vicinity of these deposits were able to take advantage of it for household warmth.
During the Industrial Revolution, it was the invention of the first coal-powered, commercially practical locomotives that turned the tide. Although wood would still be used in the majority of locomotives until 1870, the transition to fossil fuels had begun.
Coke, a product of heating certain types of coal, replaced wood charcoal as the fuel for iron blast furnaces in 1875. Thomas Edison built the first practical coal-fired electric generating station in 1882, which supplied electricity to some residents in New York City. It was just after this time in the 1910s that the United States would be the largest coal producer in the world with 750,000 miners and blasting 550 million tons of coal a year.
The invention of the internal combustion engine and the development of new electrical technologies, including those developed by people like Thomas Edison and Nikola Tesla, were the first steps towards today’s modern power landscape. Fuels such as petroleum and natural gas became very useful, and the first mass-scale hydroelectric stations were built such as Hoover Dam, which opened in 1936.
The discovery and advancement of nuclear technology led to the first nuclear submarine in 1954, and the first commercial nuclear power plant in the United States in Pennsylvania in 1957. In a relatively short period of time, nuclear would have a profound effect on energy supply, and it today 99 nuclear reactors account for 20% of all electricity generated in the United States.
Related Topic: What it Takes to Power New York (Slideshow)
In more recent decades, scientists found that the current energy mix is not ideal from an environmental perspective. Advancements in renewable energy solutions such as solar, wind, and geothermal were made, helping set up a potential energy revolution. Battery technology, a key challenge for many years, has began to catch up to allow us to store larger amounts of energy when the sun isn’t shining or the wind isn’t blowing. Companies like Tesla are spending billions of dollars on battery megafactories that will have a great impact on our energy use.
Today, the United States gets the majority of its energy from fossil fuels, though that percentage is slowly decreasing. While oil is still the primary fuel of choice for transportation, it now only generates 1% of the country’s electricity through power plants. Natural gas has also taken on a bigger role over time, because it is perceived as being cleaner than oil and coal.
Today, in 2015, wind and solar power have generated 5% and 1% of total electricity respectively. Hydro generates 7%.


Energy
Mapped: The Age of Energy Projects in Interconnection Queues, by State
This map shows how many energy projects are in interconnection queues by state and how long these projects have been queued up, on average.


Age of Energy Projects in Interconnection Queues, by State
This was originally posted on our Voronoi app. Download the app for free on iOS or Android and discover incredible data-driven charts from a variety of trusted sources.
By the end of 2023, more than 11,000 energy projects were in interconnection queues in the United States, waiting for a green-light from regional grid operators to proceed with construction.
This map, created in partnership with the National Public Utilities Council, maps out the average age of active energy projects in interconnection queues by state, using data from Berkeley Lab.
Interconnection Queues, Explained
Interconnection queues are lists of energy projects that have made interconnection requests to their regional grid operators. Once submitted, these requests formally initiate the impact study process that each project goes through before grid connection, forming waiting lists for approval known as interconnection queues.
In recent years, both the number and generation capacity of queued projects have surged in the United States, along with the length of time spent in queue.
According to Berkeley Lab, the amount of generation capacity entering queues each year has risen by more than 550% from 2015 to 2023, with average queue duration rising from 3 years to 5 years the same period.
As a result of the growing backlog, a large proportion of projects ultimately withdraw from queues, leading to only 19% of applications reaching commercial operations.
The Backlog: Number of Projects and Average Wait Times
Of the 11,000 active projects in U.S. queues at the end of 2023, Texas, California, and Virginia had the most in queue; 1,208, 947, and 743, respectively.
When looking at the average ages of these projects, all three states hovered around the national average of 34 months (2.83 years), with Texas sporting 28 months, California 33, and Virginia 34.
Vermont, Minnesota, Wisconsin, and Florida, on the other hand, had the highest average queue durations; 54, 49, 47, and 46 months, respectively.
Average Queue Duration by Project Type
At the end of 2023, more than 95% of the generation capacity in active interconnection queues was for emission-free resources. The table below provides a breakdown.
| Project Type | Average Queue Duration (As of 12/31/2023) | Number of Projects in Queue |
|---|---|---|
| Wind | 40 months | 841 |
| Solar | 34 months | 4,506 |
| Wind+Battery | 34 months | 76 |
| Solar+Battery | 27 months | 2,377 |
| Battery | 24 months | 2,818 |
Wind projects had the highest wait times at the end of 2023 with an average age of 40 months (3.33 years). Solar projects, on the other hand, made up more than 40% of projects in queue.
Overall, reducing the time that these renewable energy projects spend in queues can accelerate the transition to a low-carbon energy future.
According to the U.S. Department of Energy, enhancing data transparency, streamlining approval processes, promoting economic efficiency, and maintaining a reliable grid are some of the ways this growing backlog can be mitigated.

-

 Culture6 days ago
The World’s Top Media Franchises by All-Time Revenue
-

 Science2 weeks ago
Visualizing the Average Lifespans of Mammals
-

 Brands2 weeks ago
How Tech Logos Have Evolved Over Time
-

 Energy2 weeks ago
Ranked: The Top 10 EV Battery Manufacturers in 2023
-

 Demographics2 weeks ago
Countries With the Largest Happiness Gains Since 2010
-

 VC+2 weeks ago
VC+: Get Our Key Takeaways From the IMF’s World Economic Outlook
-

 Demographics2 weeks ago
The Countries That Have Become Sadder Since 2010
-

 Money1 week ago
Charted: Who Has Savings in This Economy?