Energy
Mapping Every Power Plant in the United States
Note: Updated to reflect 2017 numbers
The Washington Post has put together an extraordinary data visualization that shows how the United States has generated its electricity so far this year. Using data from the Energy Information Administration, they have mapped every power source and categorized it by type and size.
Related Topic: What it Takes to Power New York (Slideshow)
I will recap the most interesting parts of their project here, but we highly recommend that you visit their online interactive version of this visualization to get the most out of their work.
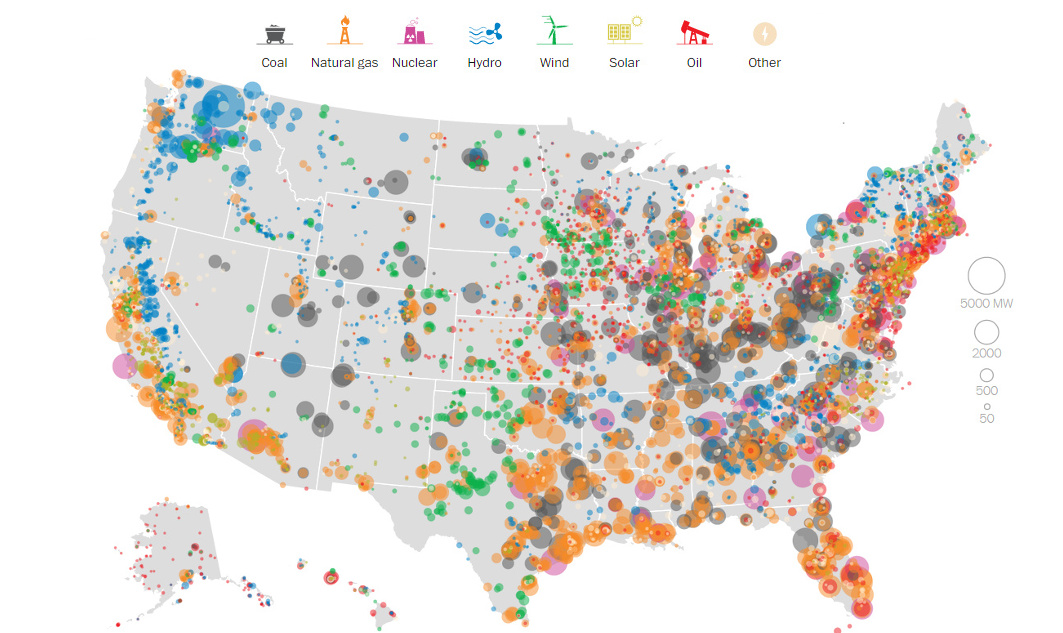
Plant Capacity by Megawatt
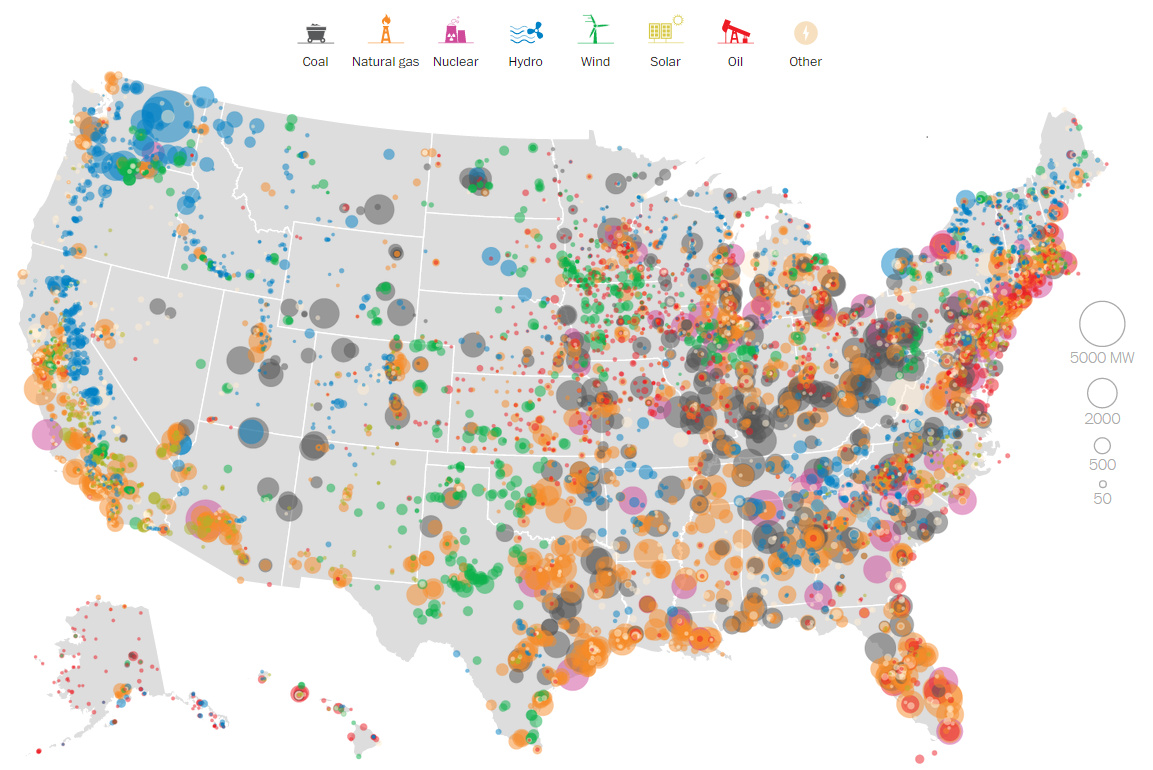
This above visualization is a little overwhelming, as it includes every power source in America. However, later on we will show various visualizations by power type, which make it easier to make sense of.
Power Generated by Source: Coal
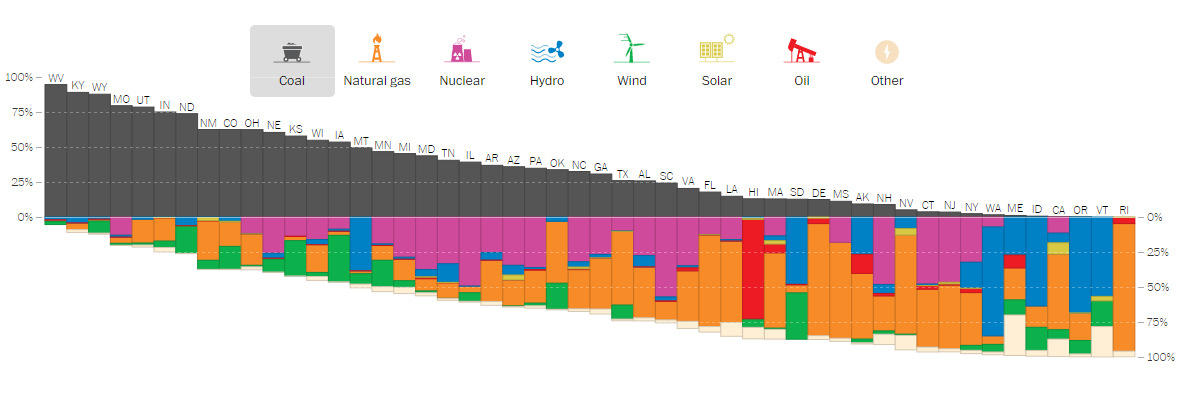
Data visualized like this shows there is still a large reliance on specific energy types such as coal, hydro, and nuclear. For example, in 2017, 27 states still rely on coal to produce at least 25% of their electricity.
Meanwhile, the following chart on solar shows how far photovoltaics still have to go to make a significant impact in the overall energy mix.
Power Generated by Source: Solar
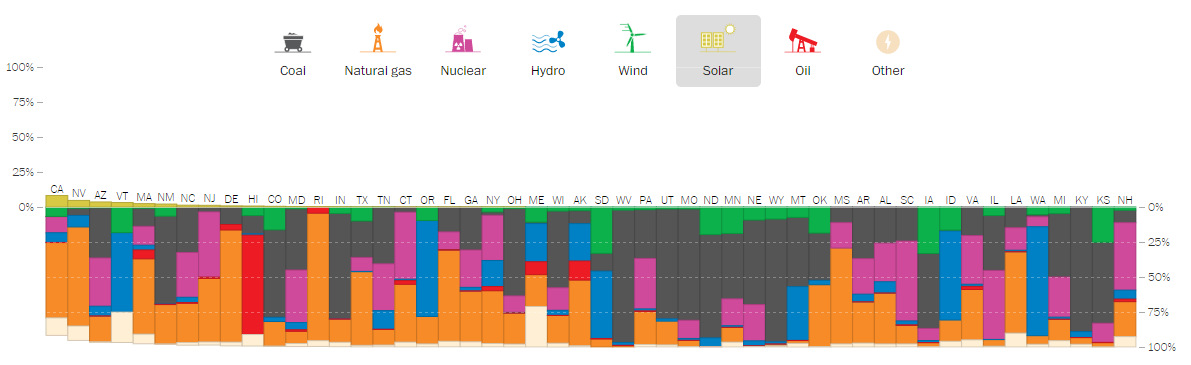
While community solar farms are starting to take off in the United States, solar technology as a whole still does not provide substantial amounts of electricity. It is clear that California is the leader in solar capacity, but it actually only accounts for 10% of total electricity generation in the state.
Coal Power Map
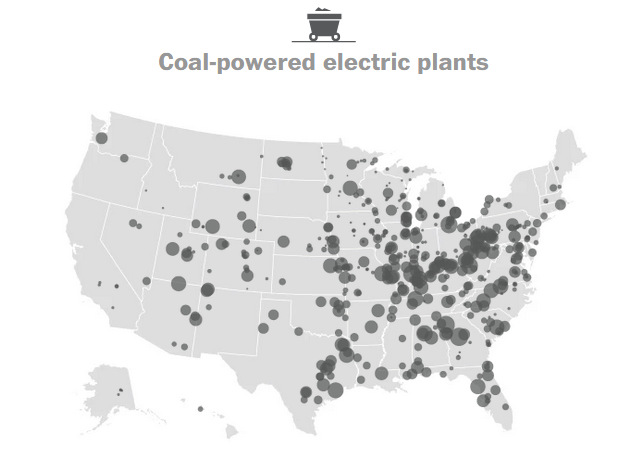
The United States has 400 coal-fired power plants that generate 30% of the nation’s electricity. Coal produces the majority of energy in 13 sates, but thanks to America’s Clean Power Plan, a whopping 111 plants have been shut down since 2015.
Natural Gas Power Map
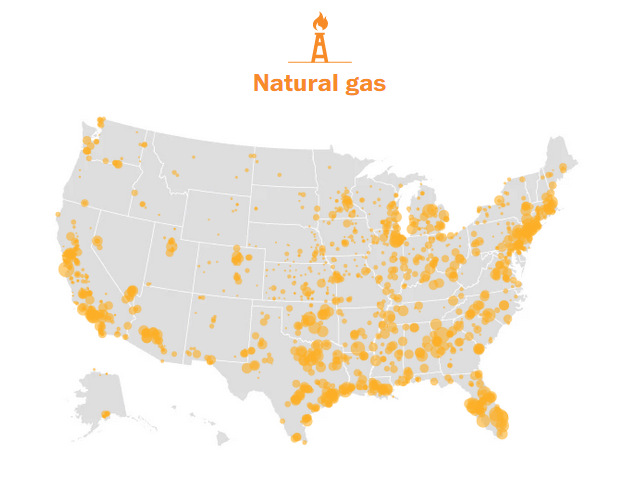
The United States has 1,793 natural gas power plants that generate 34% of the nation’s electricity. Natural gas is the primary source of power in 19 states.
Nuclear Power Map
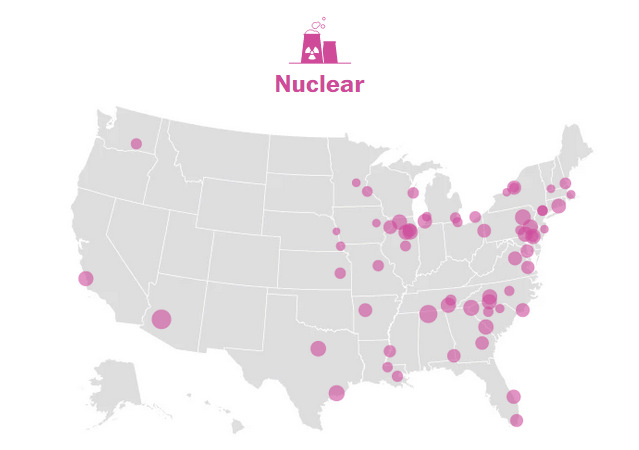
The United States has 61 nuclear reactors that generate 20% of the nation’s electricity. 20 states get no power from nuclear at all.
Hydro Power Map
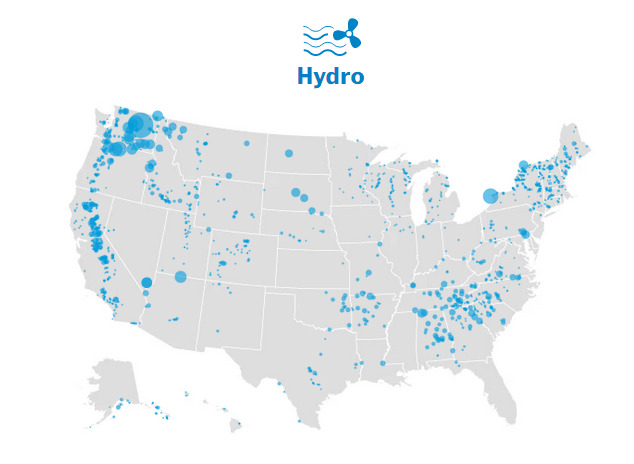
The United States has 1,444 hydroelectric dams that generate 7% of the nation’s electricity. The Grand Coulee Dam in Washington State has 6,809 MW of installed capacity, making it the largest contributor in nameplate capacity in the country. (However, as Forbes notes, actual electricity generated depends on capacity factor.)
Wind Power Map

The United States has 999 wind power plants that generate 6% of the nation’s electricity. The best source for wind is in the Great Plains, where it blows very reliably. Around 2010, China leapfrogged the USA with parabolic wind power growth.
Solar Power Map
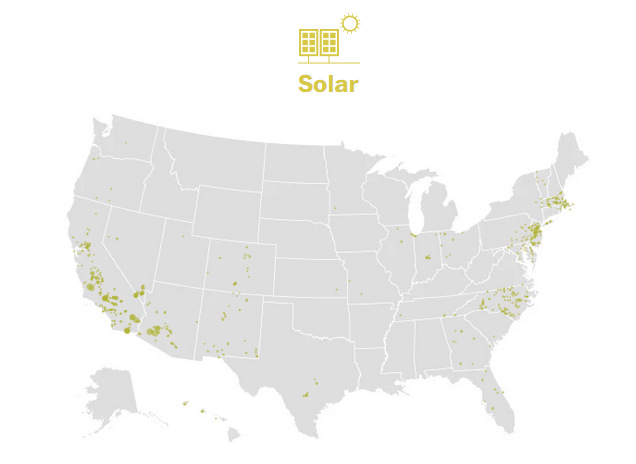
The United States has 1,721 solar power plants that generate 1% of the nation’s electricity.
Oil Power Map
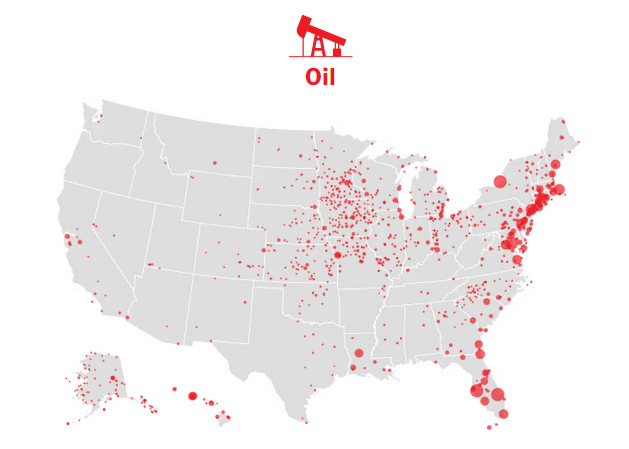
The United States has 1,076 oil-fired power plants that generate less than 1% of the nation’s electricity. America is shaking off its addiction to oil and no longer relies on it for generating electricity because of price swings. Hawaii is the only state to get the majority of its energy from oil.


Energy
Charted: 4 Reasons Why Lithium Could Be the Next Gold Rush
Visual Capitalist has partnered with EnergyX to show why drops in prices and growing demand may make now the right time to invest in lithium.


4 Reasons Why You Should Invest in Lithium
Lithium’s importance in powering EVs makes it a linchpin of the clean energy transition and one of the world’s most precious minerals.
In this graphic, Visual Capitalist partnered with EnergyX to explore why now may be the time to invest in lithium.
1. Lithium Prices Have Dropped
One of the most critical aspects of evaluating an investment is ensuring that the asset’s value is higher than its price would indicate. Lithium is integral to powering EVs, and, prices have fallen fast over the last year:
| Date | LiOH·H₂O* | Li₂CO₃** |
|---|---|---|
| Feb 2023 | $76 | $71 |
| March 2023 | $71 | $61 |
| Apr 2023 | $43 | $33 |
| May 2023 | $43 | $33 |
| June 2023 | $47 | $45 |
| July 2023 | $44 | $40 |
| Aug 2023 | $35 | $35 |
| Sept 2023 | $28 | $27 |
| Oct 2023 | $24 | $23 |
| Nov 2023 | $21 | $21 |
| Dec 2023 | $17 | $16 |
| Jan 2024 | $14 | $15 |
| Feb 2024 | $13 | $14 |
Note: Monthly spot prices were taken as close to the 14th of each month as possible.
*Lithium hydroxide monohydrate MB-LI-0033
**Lithium carbonate MB-LI-0029
2. Lithium-Ion Battery Prices Are Also Falling
The drop in lithium prices is just one reason to invest in the metal. Increasing economies of scale, coupled with low commodity prices, have caused the cost of lithium-ion batteries to drop significantly as well.
In fact, BNEF reports that between 2013 and 2023, the price of a Li-ion battery dropped by 82%.
| Year | Price per KWh |
|---|---|
| 2023 | $139 |
| 2022 | $161 |
| 2021 | $150 |
| 2020 | $160 |
| 2019 | $183 |
| 2018 | $211 |
| 2017 | $258 |
| 2016 | $345 |
| 2015 | $448 |
| 2014 | $692 |
| 2013 | $780 |

3. EV Adoption is Sustainable
One of the best reasons to invest in lithium is that EVs, one of the main drivers behind the demand for lithium, have reached a price point similar to that of traditional vehicle.
According to the Kelly Blue Book, Tesla’s average transaction price dropped by 25% between 2022 and 2023, bringing it in line with many other major manufacturers and showing that EVs are a realistic transport option from a consumer price perspective.
| Manufacturer | September 2022 | September 2023 |
|---|---|---|
| BMW | $69,000 | $72,000 |
| Ford | $54,000 | $56,000 |
| Volkswagon | $54,000 | $56,000 |
| General Motors | $52,000 | $53,000 |
| Tesla | $68,000 | $51,000 |
4. Electricity Demand in Transport is Growing
As EVs become an accessible transport option, there’s an investment opportunity in lithium. But possibly the best reason to invest in lithium is that the IEA reports global demand for the electricity in transport could grow dramatically by 2030:
| Transport Type | 2022 | 2025 | 2030 |
|---|---|---|---|
| Buses 🚌 | 23,000 GWh | 50,000 GWh | 130,000 GWh |
| Cars 🚙 | 65,000 GWh | 200,000 GWh | 570,000 GWh |
| Trucks 🛻 | 4,000 GWh | 15,000 GWh | 94,000 GWh |
| Vans 🚐 | 6,000 GWh | 16,000 GWh | 72,000 GWh |
The Lithium Investment Opportunity
Lithium presents a potentially classic investment opportunity. Lithium and battery prices have dropped significantly, and recently, EVs have reached a price point similar to other vehicles. By 2030, the demand for clean energy, especially in transport, will grow dramatically.
With prices dropping and demand skyrocketing, now is the time to invest in lithium.
EnergyX is poised to exploit lithium demand with cutting-edge lithium extraction technology capable of extracting 300% more lithium than current processes.

-

 Lithium4 days ago
Ranked: The Top 10 EV Battery Manufacturers in 2023
Asia dominates this ranking of the world’s largest EV battery manufacturers in 2023.
-

 Energy1 week ago
The World’s Biggest Nuclear Energy Producers
China has grown its nuclear capacity over the last decade, now ranking second on the list of top nuclear energy producers.
-

 Energy1 month ago
The World’s Biggest Oil Producers in 2023
Just three countries accounted for 40% of global oil production last year.
-

 Energy1 month ago
How Much Does the U.S. Depend on Russian Uranium?
Currently, Russia is the largest foreign supplier of nuclear power fuel to the U.S.
-

 Uranium2 months ago
Charted: Global Uranium Reserves, by Country
We visualize the distribution of the world’s uranium reserves by country, with 3 countries accounting for more than half of total reserves.
-

 Energy3 months ago
Visualizing the Rise of the U.S. as Top Crude Oil Producer
Over the last decade, the United States has established itself as the world’s top producer of crude oil, surpassing Saudi Arabia and Russia.


-

 Education1 week ago
How Hard Is It to Get Into an Ivy League School?
-

 Technology2 weeks ago
Ranked: Semiconductor Companies by Industry Revenue Share
-

 Markets2 weeks ago
Ranked: The World’s Top Flight Routes, by Revenue
-

 Demographics2 weeks ago
Population Projections: The World’s 6 Largest Countries in 2075
-

 Markets2 weeks ago
The Top 10 States by Real GDP Growth in 2023
-

 Demographics2 weeks ago
The Smallest Gender Wage Gaps in OECD Countries
-

 Economy2 weeks ago
Where U.S. Inflation Hit the Hardest in March 2024
-

 Green2 weeks ago
Top Countries By Forest Growth Since 2001