Energy
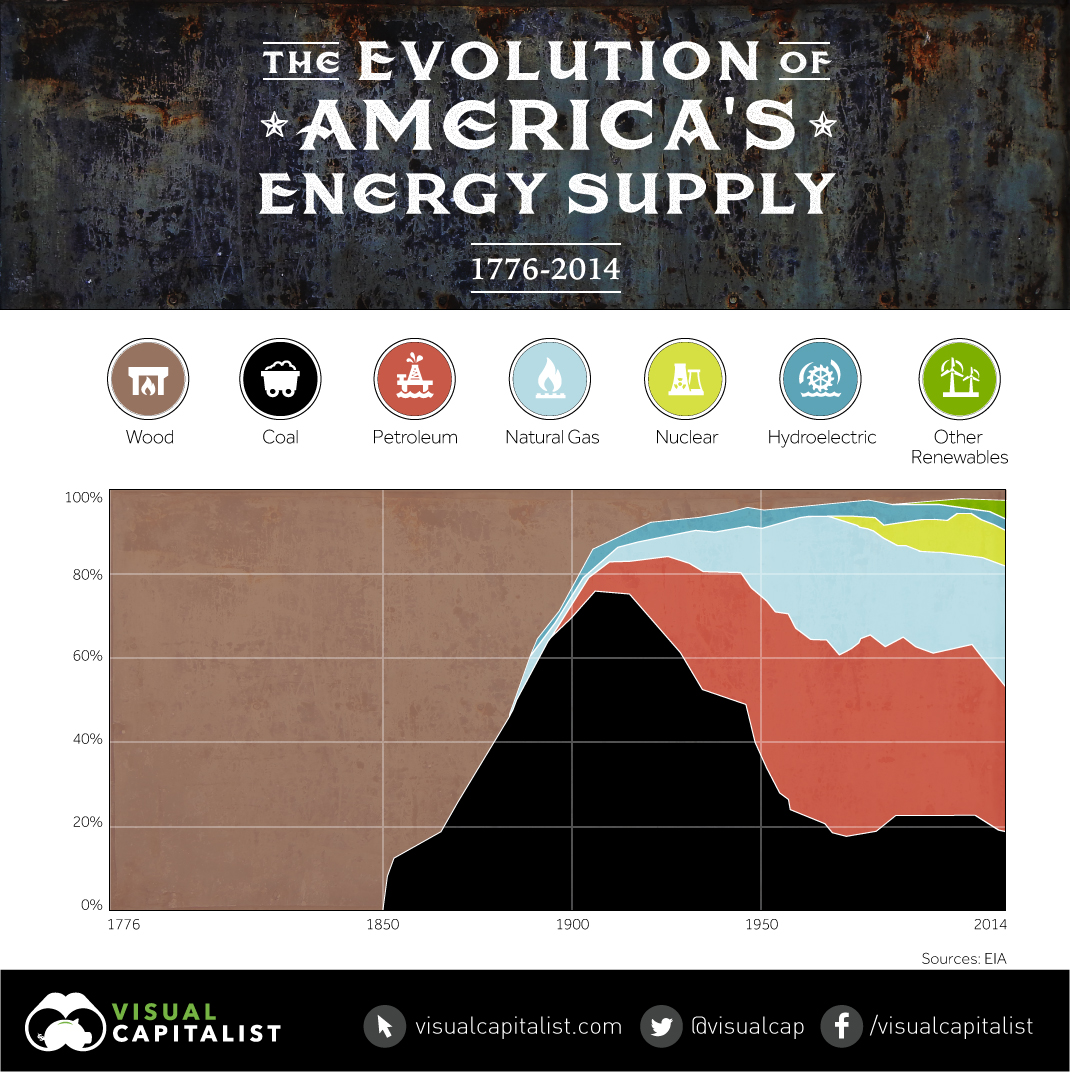
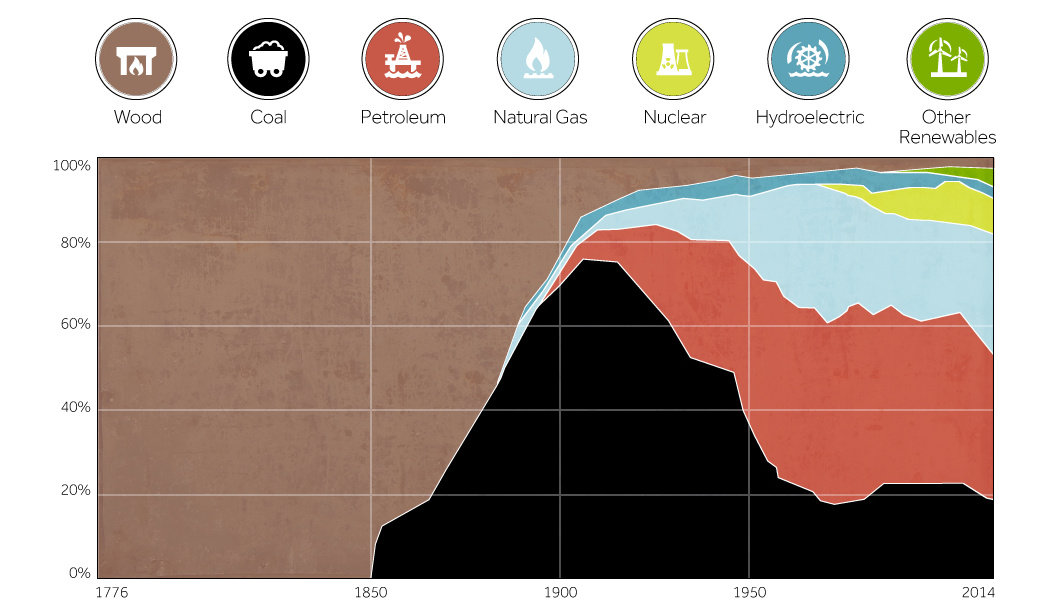
The Evolution of America’s Energy Supply (1776 – 2014)
The Evolution of America’s Energy Supply (1776 – 2014)
The Energy Information Administration (EIA) recently released data on the history of America’s energy supply, sorted by the share of each energy source. We’ve taken that data to create the chart associated with today’s post.
Related Topic: Mapping Every Power Plant in the United States
The early settlers to North America relied on organic materials on the surface of land for the vast majority of their energy needs. Wood, brush, and other biomass fuels were burned to warm homes, and eventually to power steam engines. Small amounts of coal were found in riverbeds and other such outcrops, but only local homes in the vicinity of these deposits were able to take advantage of it for household warmth.
During the Industrial Revolution, it was the invention of the first coal-powered, commercially practical locomotives that turned the tide. Although wood would still be used in the majority of locomotives until 1870, the transition to fossil fuels had begun.
Coke, a product of heating certain types of coal, replaced wood charcoal as the fuel for iron blast furnaces in 1875. Thomas Edison built the first practical coal-fired electric generating station in 1882, which supplied electricity to some residents in New York City. It was just after this time in the 1910s that the United States would be the largest coal producer in the world with 750,000 miners and blasting 550 million tons of coal a year.
The invention of the internal combustion engine and the development of new electrical technologies, including those developed by people like Thomas Edison and Nikola Tesla, were the first steps towards today’s modern power landscape. Fuels such as petroleum and natural gas became very useful, and the first mass-scale hydroelectric stations were built such as Hoover Dam, which opened in 1936.
The discovery and advancement of nuclear technology led to the first nuclear submarine in 1954, and the first commercial nuclear power plant in the United States in Pennsylvania in 1957. In a relatively short period of time, nuclear would have a profound effect on energy supply, and it today 99 nuclear reactors account for 20% of all electricity generated in the United States.
Related Topic: What it Takes to Power New York (Slideshow)
In more recent decades, scientists found that the current energy mix is not ideal from an environmental perspective. Advancements in renewable energy solutions such as solar, wind, and geothermal were made, helping set up a potential energy revolution. Battery technology, a key challenge for many years, has began to catch up to allow us to store larger amounts of energy when the sun isn’t shining or the wind isn’t blowing. Companies like Tesla are spending billions of dollars on battery megafactories that will have a great impact on our energy use.
Today, the United States gets the majority of its energy from fossil fuels, though that percentage is slowly decreasing. While oil is still the primary fuel of choice for transportation, it now only generates 1% of the country’s electricity through power plants. Natural gas has also taken on a bigger role over time, because it is perceived as being cleaner than oil and coal.
Today, in 2015, wind and solar power have generated 5% and 1% of total electricity respectively. Hydro generates 7%.


Energy
The World’s Biggest Nuclear Energy Producers
China has grown its nuclear capacity over the last decade, now ranking second on the list of top nuclear energy producers.


The World’s Biggest Nuclear Energy Producers
This was originally posted on our Voronoi app. Download the app for free on Apple or Android and discover incredible data-driven charts from a variety of trusted sources.
Scientists in South Korea recently broke a record in a nuclear fusion experiment. For 48 seconds, they sustained a temperature seven times that of the sun’s core.
But generating commercially viable energy from nuclear fusion still remains more science fiction than reality. Meanwhile, its more reliable sibling, nuclear fission, has been powering our world for many decades.
In this graphic, we visualized the top producers of nuclear energy by their share of the global total, measured in terawatt hours (TWh). Data for this was sourced from the Nuclear Energy Institute, last updated in August 2022.
Which Country Generates the Most Nuclear Energy?
Nuclear energy production in the U.S. is more than twice the amount produced by China (ranked second) and France (ranked third) put together. In total, the U.S. accounts for nearly 30% of global nuclear energy output.
However, nuclear power only accounts for one-fifth of America’s electricity supply. This is in contrast to France, which generates 60% of its electricity from nuclear plants.
| Rank | Country | Nuclear Energy Produced (TWh) | % of Total |
|---|---|---|---|
| 1 | 🇺🇸 U.S. | 772 | 29% |
| 2 | 🇨🇳 China | 383 | 14% |
| 3 | 🇫🇷 France | 363 | 14% |
| 4 | 🇷🇺 Russia | 208 | 8% |
| 5 | 🇰🇷 South Korea | 150 | 6% |
| 6 | 🇨🇦 Canada | 87 | 3% |
| 7 | 🇺🇦 Ukraine | 81 | 3% |
| 8 | 🇩🇪 Germany | 65 | 2% |
| 9 | 🇯🇵 Japan | 61 | 2% |
| 10 | 🇪🇸 Spain | 54 | 2% |
| 11 | 🇸🇪 Sweden | 51 | 2% |
| 12 | 🇧🇪 Belgium | 48 | 2% |
| 13 | 🇬🇧 UK | 42 | 2% |
| 14 | 🇮🇳 India | 40 | 2% |
| 15 | 🇨🇿 Czech Republic | 29 | 1% |
| N/A | 🌐 Other | 219 | 8% |
| N/A | 🌍 Total | 2,653 | 100% |
Another highlight is how China has rapidly grown its nuclear energy capabilities in the last decade. Between 2016 and 2021, for example, it increased its share of global nuclear energy output from less than 10% to more than 14%, overtaking France for second place.
On the opposite end, the UK’s share has slipped to 2% over the same time period.
Meanwhile, Ukraine has heavily relied on nuclear energy to power its grid. In March 2022, it lost access to its key Zaporizhzhia Nuclear Power Station after Russian forces wrested control of the facility. With six 1,000 MW reactors, the plant is one of the largest in Europe. It is currently not producing any power, and has been the site of recent drone attacks.

-

 Green2 weeks ago
Ranked: Top Countries by Total Forest Loss Since 2001
-

 Travel1 week ago
Ranked: The World’s Top Flight Routes, by Revenue
-

 Technology1 week ago
Ranked: Semiconductor Companies by Industry Revenue Share
-

 Money2 weeks ago
Which States Have the Highest Minimum Wage in America?
-

 Real Estate2 weeks ago
Ranked: The Most Valuable Housing Markets in America
-

 Markets2 weeks ago
Charted: Big Four Market Share by S&P 500 Audits
-

 AI2 weeks ago
The Stock Performance of U.S. Chipmakers So Far in 2024
-

 Automotive2 weeks ago
Almost Every EV Stock is Down After Q1 2024