Energy
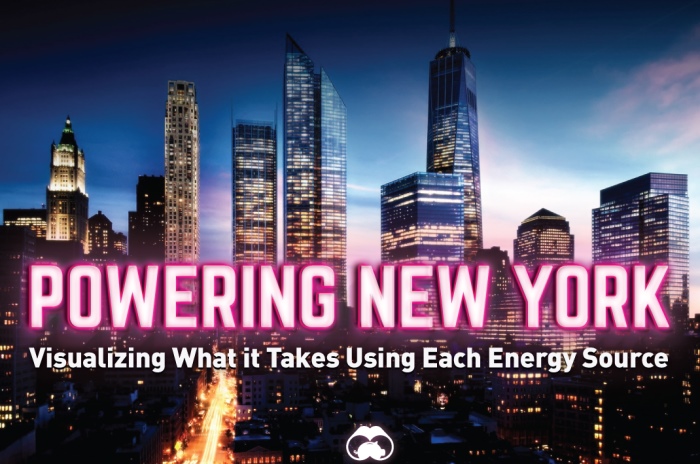
[Slideshow] Powering New York
[Slideshow] Powering New York
Imagine that overnight all power infrastructure in New York were to disappear. Then, starting from scratch, we could build anything we wanted: a giant solar array that stretches to the horizon, the world’s biggest windfarm, or a mega nuclear facility.
What would it take to power the Big Apple for a year with each individual energy source?
We’ve crunched the numbers for oil, natural gas, liquefied natural gas, solar, wind, and hydro. Then, we visualized what is needed for each to be hypothetically feasible as the city’s only source of energy. (Note: we’ve included some notes on our calculations at the bottom of this page.)
The results are quite mind boggling. For example, to facilitate New York City’s average power needs, you would need 12.8 km² of solar panels, enough to cover a good chunk of New Jersey. The average distance one can see into the horizon is 5km, which means that one would be able to see solar panels as far as the eye can see.
Another interesting example: powering New York City with hydroelectric based on average power needs would mean 14 Hoover Dams, each which produce about 4.2 billion kWh per year in energy. Using wind power, about half of Long Island would need to be converted into the world’s biggest wind farm to power New York City. That’s exponentially bigger than the current biggest wind farm in the United States, which is in the Tehachapi-Mojave region in California and has a nameplate capacity of 1,320 MW.
Quick notes on calculations
This presentation is for visualization purposes, and isn’t fully realistic on a technical basis because in reality, the supply and demand of energy is not constant. The city’s power needs fluctuate during base and peak load times. In terms of supply, the wind is not always blowing and the sun isn’t always shining. We based our numbers off of average electricity consumption, assuming that energy can be banked in times of surplus and used during times of deficiency.
We used some assumptions for the efficiency as well. For example, that a power plant burning oil has an efficiency of 533 kWh per barrel, or that our wind farm uses 1.5 MW turbines that have a capacity factor of 25%.
Use and share this presentation
Feel free to use or share this presentation by either:
- Using the embed code on the slideshow
- Saving the images and using them directly. Here’s a dump of all images used in a zip..
- Sharing and/or linking directly to this page
If you use this, it is appreciated if you can give attribution credit back to Visual Capitalist
Gold: The Most Sought After Metal on Earth
 A Year’s Extraction of Metals Next to Landmarks


Lithium
Ranked: The Top 10 EV Battery Manufacturers in 2023
Asia dominates this ranking of the world’s largest EV battery manufacturers in 2023.


The Top 10 EV Battery Manufacturers in 2023
This was originally posted on our Voronoi app. Download the app for free on iOS or Android and discover incredible data-driven charts from a variety of trusted sources.
Despite efforts from the U.S. and EU to secure local domestic supply, all major EV battery manufacturers remain based in Asia.
In this graphic we rank the top 10 EV battery manufacturers by total battery deployment (measured in megawatt-hours) in 2023. The data is from EV Volumes.
Chinese Dominance
Contemporary Amperex Technology Co. Limited (CATL) has swiftly risen in less than a decade to claim the title of the largest global battery group.
The Chinese company now has a 34% share of the market and supplies batteries to a range of made-in-China vehicles, including the Tesla Model Y, SAIC’s MG4/Mulan, and various Li Auto models.
| Company | Country | 2023 Production (megawatt-hour) | Share of Total Production |
|---|---|---|---|
| CATL | 🇨🇳 China | 242,700 | 34% |
| BYD | 🇨🇳 China | 115,917 | 16% |
| LG Energy Solution | 🇰🇷 Korea | 108,487 | 15% |
| Panasonic | 🇯🇵 Japan | 56,560 | 8% |
| SK On | 🇰🇷 Korea | 40,711 | 6% |
| Samsung SDI | 🇰🇷 Korea | 35,703 | 5% |
| CALB | 🇨🇳 China | 23,493 | 3% |
| Farasis Energy | 🇨🇳 China | 16,527 | 2% |
| Envision AESC | 🇨🇳 China | 8,342 | 1% |
| Sunwoda | 🇨🇳 China | 6,979 | 1% |
| Other | - | 56,040 | 8% |
In 2023, BYD surpassed LG Energy Solution to claim second place. This was driven by demand from its own models and growth in third-party deals, including providing batteries for the made-in-Germany Tesla Model Y, Toyota bZ3, Changan UNI-V, Venucia V-Online, as well as several Haval and FAW models.
The top three battery makers (CATL, BYD, LG) collectively account for two-thirds (66%) of total battery deployment.
Once a leader in the EV battery business, Panasonic now holds the fourth position with an 8% market share, down from 9% last year. With its main client, Tesla, now sourcing batteries from multiple suppliers, the Japanese battery maker seems to be losing its competitive edge in the industry.
Overall, the global EV battery market size is projected to grow from $49 billion in 2022 to $98 billion by 2029, according to Fortune Business Insights.

-

 Travel1 week ago
Airline Incidents: How Do Boeing and Airbus Compare?
-

 Markets2 weeks ago
Visualizing America’s Shortage of Affordable Homes
-

 Green2 weeks ago
Ranked: Top Countries by Total Forest Loss Since 2001
-

 Money2 weeks ago
Where Does One U.S. Tax Dollar Go?
-

 Misc2 weeks ago
Almost Every EV Stock is Down After Q1 2024
-

 AI2 weeks ago
The Stock Performance of U.S. Chipmakers So Far in 2024
-

 Markets2 weeks ago
Charted: Big Four Market Share by S&P 500 Audits
-

 Real Estate2 weeks ago
Ranked: The Most Valuable Housing Markets in America