Which Climate Metrics Suit Your Investment Goals Best?


Which Climate Metrics Suit Your Investment Goals Best?
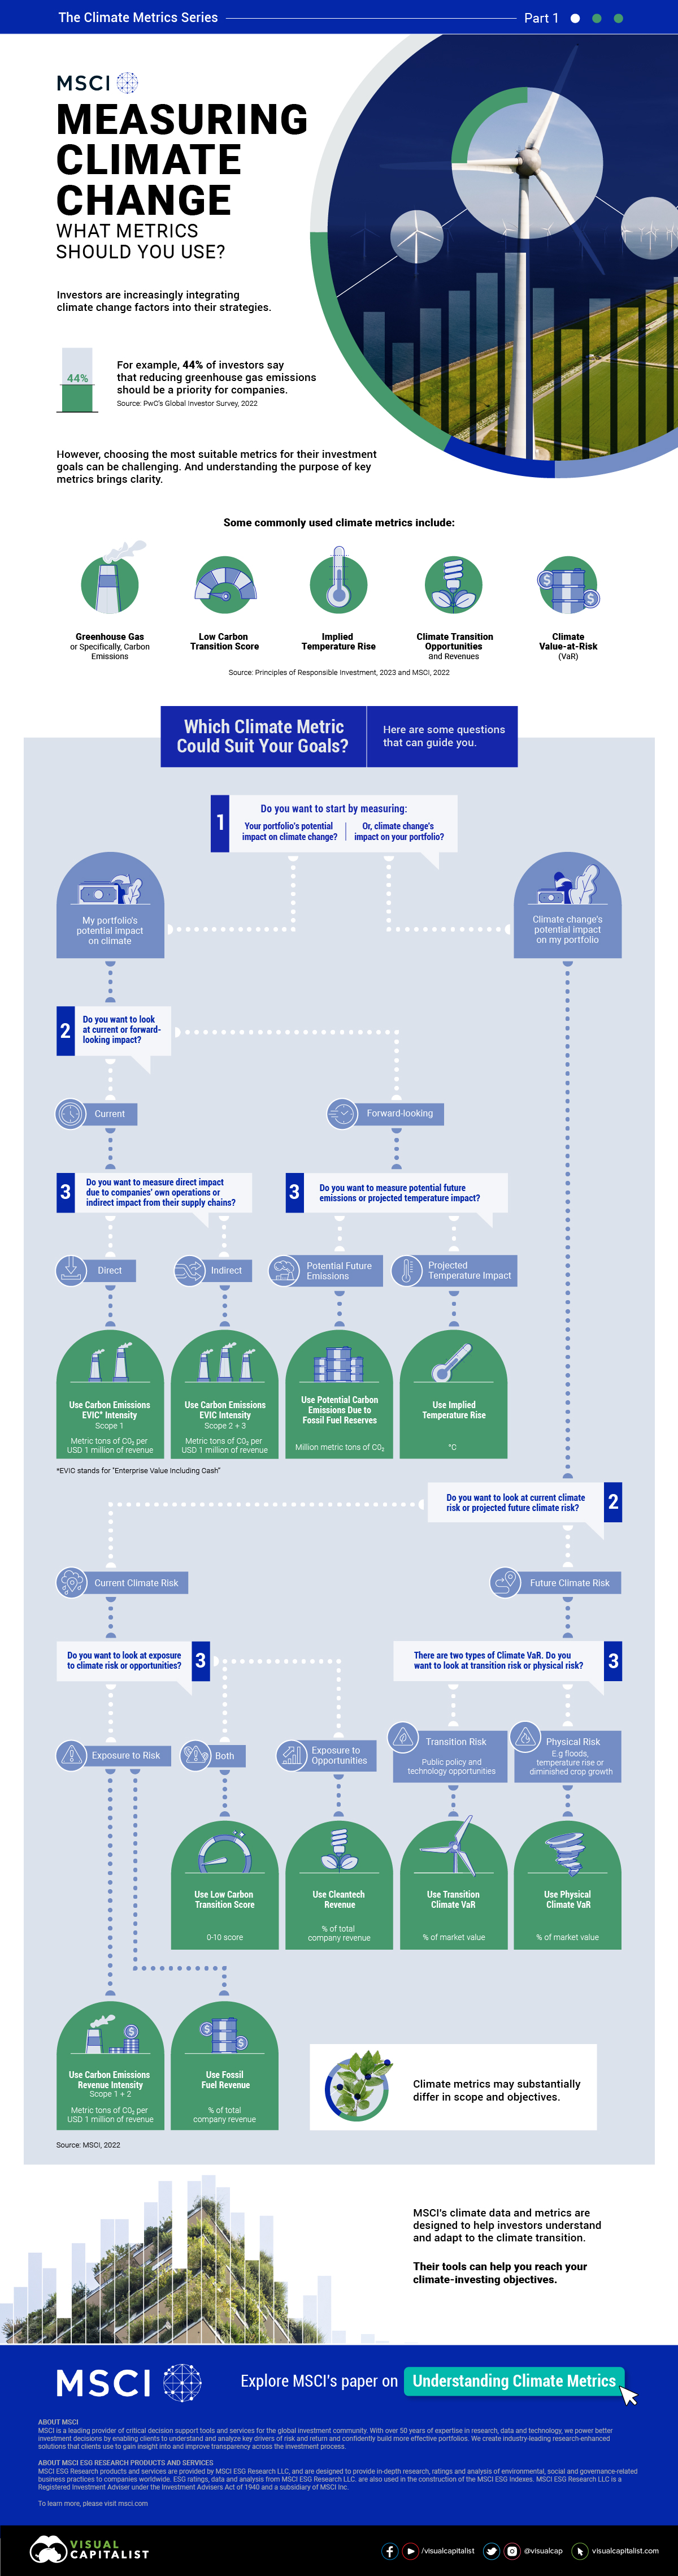
According to PwC, 44% of investors believe that companies should prioritize reducing greenhouse gas emissions across their own operations and supply chain.
In this graphic from our sponsor, MSCI, we break down climate metrics and provide valuable insights to help build sustainability-aligned portfolios without the fear of falling for greenwashing.
Essential Climate Metrics for Investors
Here are some widely-used climate metrics, as categorized by MSCI:
| Climate Metric | Description | |
|---|---|---|
| #1 | Carbon Emissions EVIC Intensity | Measures greenhouse gas emissions per $1 million of financing. |
| #2 | Potential Carbon Emissions | Estimates emissions from fossil fuel reserves owned by a company. |
| #3 | Implied Temperature Rise (ITR) | Assesses alignment with global warming scenarios. |
| #4 | Carbon Emissions Revenue Intensity | Quantifies emissions per $1 million of revenue. |
| #5 | Fossil Fuel Revenue | Determines revenue percentage from fossil fuel-related activities. |
| #6 | Cleantech Revenue | Determines revenue percentage from environmental and climate opportunities. |
| #7 | Low Carbon Transition (LCT) Score | Evaluates a company’s exposure to climate transition opportunities. |
| #8 | Transition Climate VaR | Assesses costs from carbon pricing and low-carbon opportunities. |
| #9 | Physical Climate VaR | Evaluates costs from increased exposure to physical hazards. |
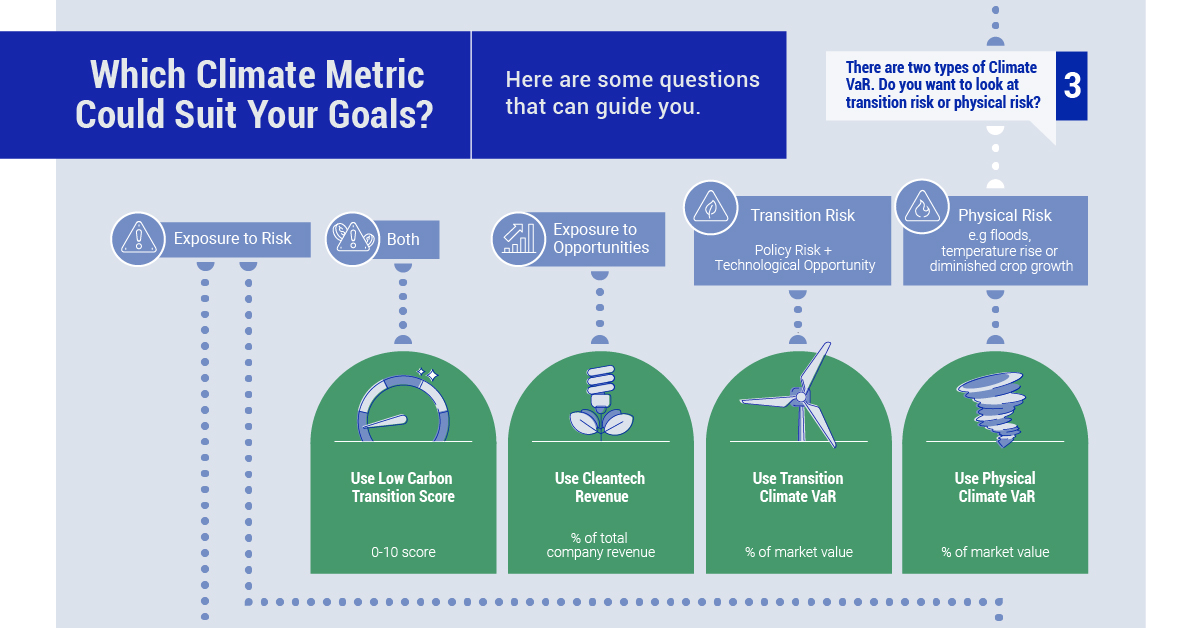
Choosing the Right Metrics
Climate investing requires selecting the right measurement tools. For that, it is important to consider your purpose, the applicability, and acceptability of the climate strategy, and the availability of historical data for analysis, among other factors. The infographic above contains a flowchart designed to guide you through several key questions.
For example, do you want to:
- Measure your portfolio’s impact on the climate or the climate’s impact on your portfolio?
- Analyze present or forward-looking data?
- Assess direct impact or indirect impact via supply chains?
- Evaluate potential future emissions or projected temperature rise?
- Focus on climate risks or opportunities?
MSCI’s climate metrics toolkit can help investors confidently measure, manage, and report their climate risks and opportunities.
Download MSCI’s climate metrics toolkit now.

-

 Investor Education6 months ago
The 20 Most Common Investing Mistakes, in One Chart
Here are the most common investing mistakes to avoid, from emotionally-driven investing to paying too much in fees.
-

 Stocks10 months ago
Visualizing BlackRock’s Top Equity Holdings
BlackRock is the world’s largest asset manager, with over $9 trillion in holdings. Here are the company’s top equity holdings.
-

 Investor Education11 months ago
10-Year Annualized Forecasts for Major Asset Classes
This infographic visualizes 10-year annualized forecasts for both equities and fixed income using data from Vanguard.
-

 Investor Education1 year ago
Visualizing 90 Years of Stock and Bond Portfolio Performance
How have investment returns for different portfolio allocations of stocks and bonds compared over the last 90 years?
-

 Debt2 years ago
Countries with the Highest Default Risk in 2022
In this infographic, we examine new data that ranks the top 25 countries by their default risk.
-

 Markets2 years ago
The Best Months for Stock Market Gains
This infographic analyzes over 30 years of stock market performance to identify the best and worst months for gains.