Visualized: What Are the Climate Risks in a Portfolio?


What Are the Climate Risks in a Portfolio?
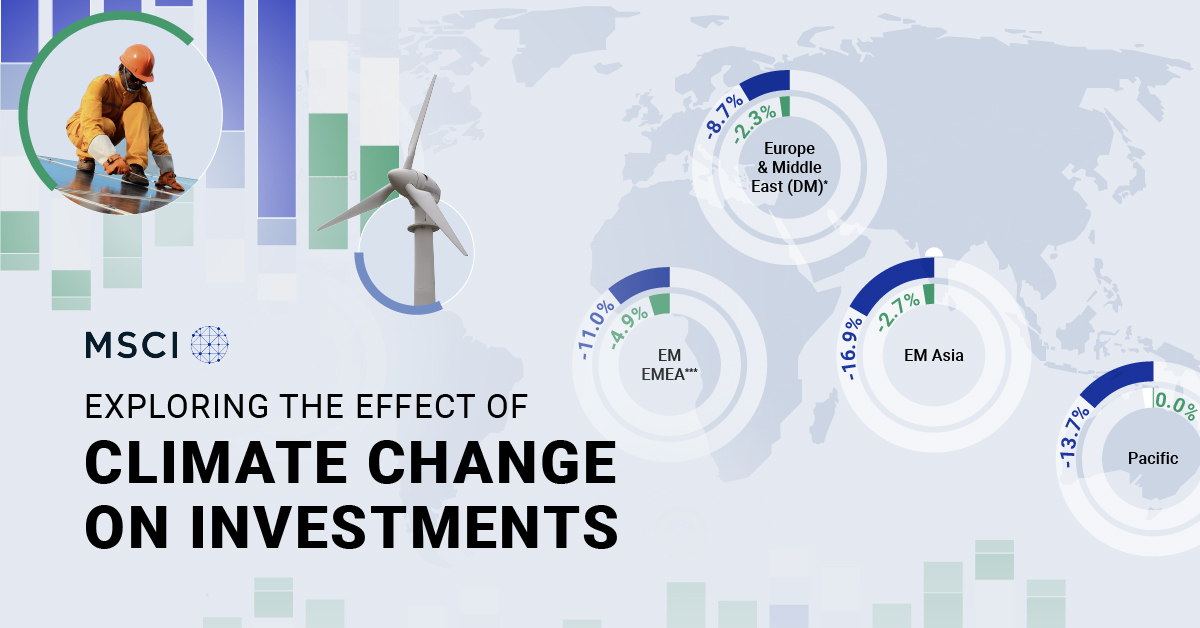
A warming planet poses clear risks to society. To that end, natural disasters, policy changes, and technological shifts all have the potential to affect an investor’s portfolio. But to what extent?
We partnered with MSCI to explore the effect of climate risk on investments, and how it can be evaluated on a regional basis.
How to Assess Climate Risks
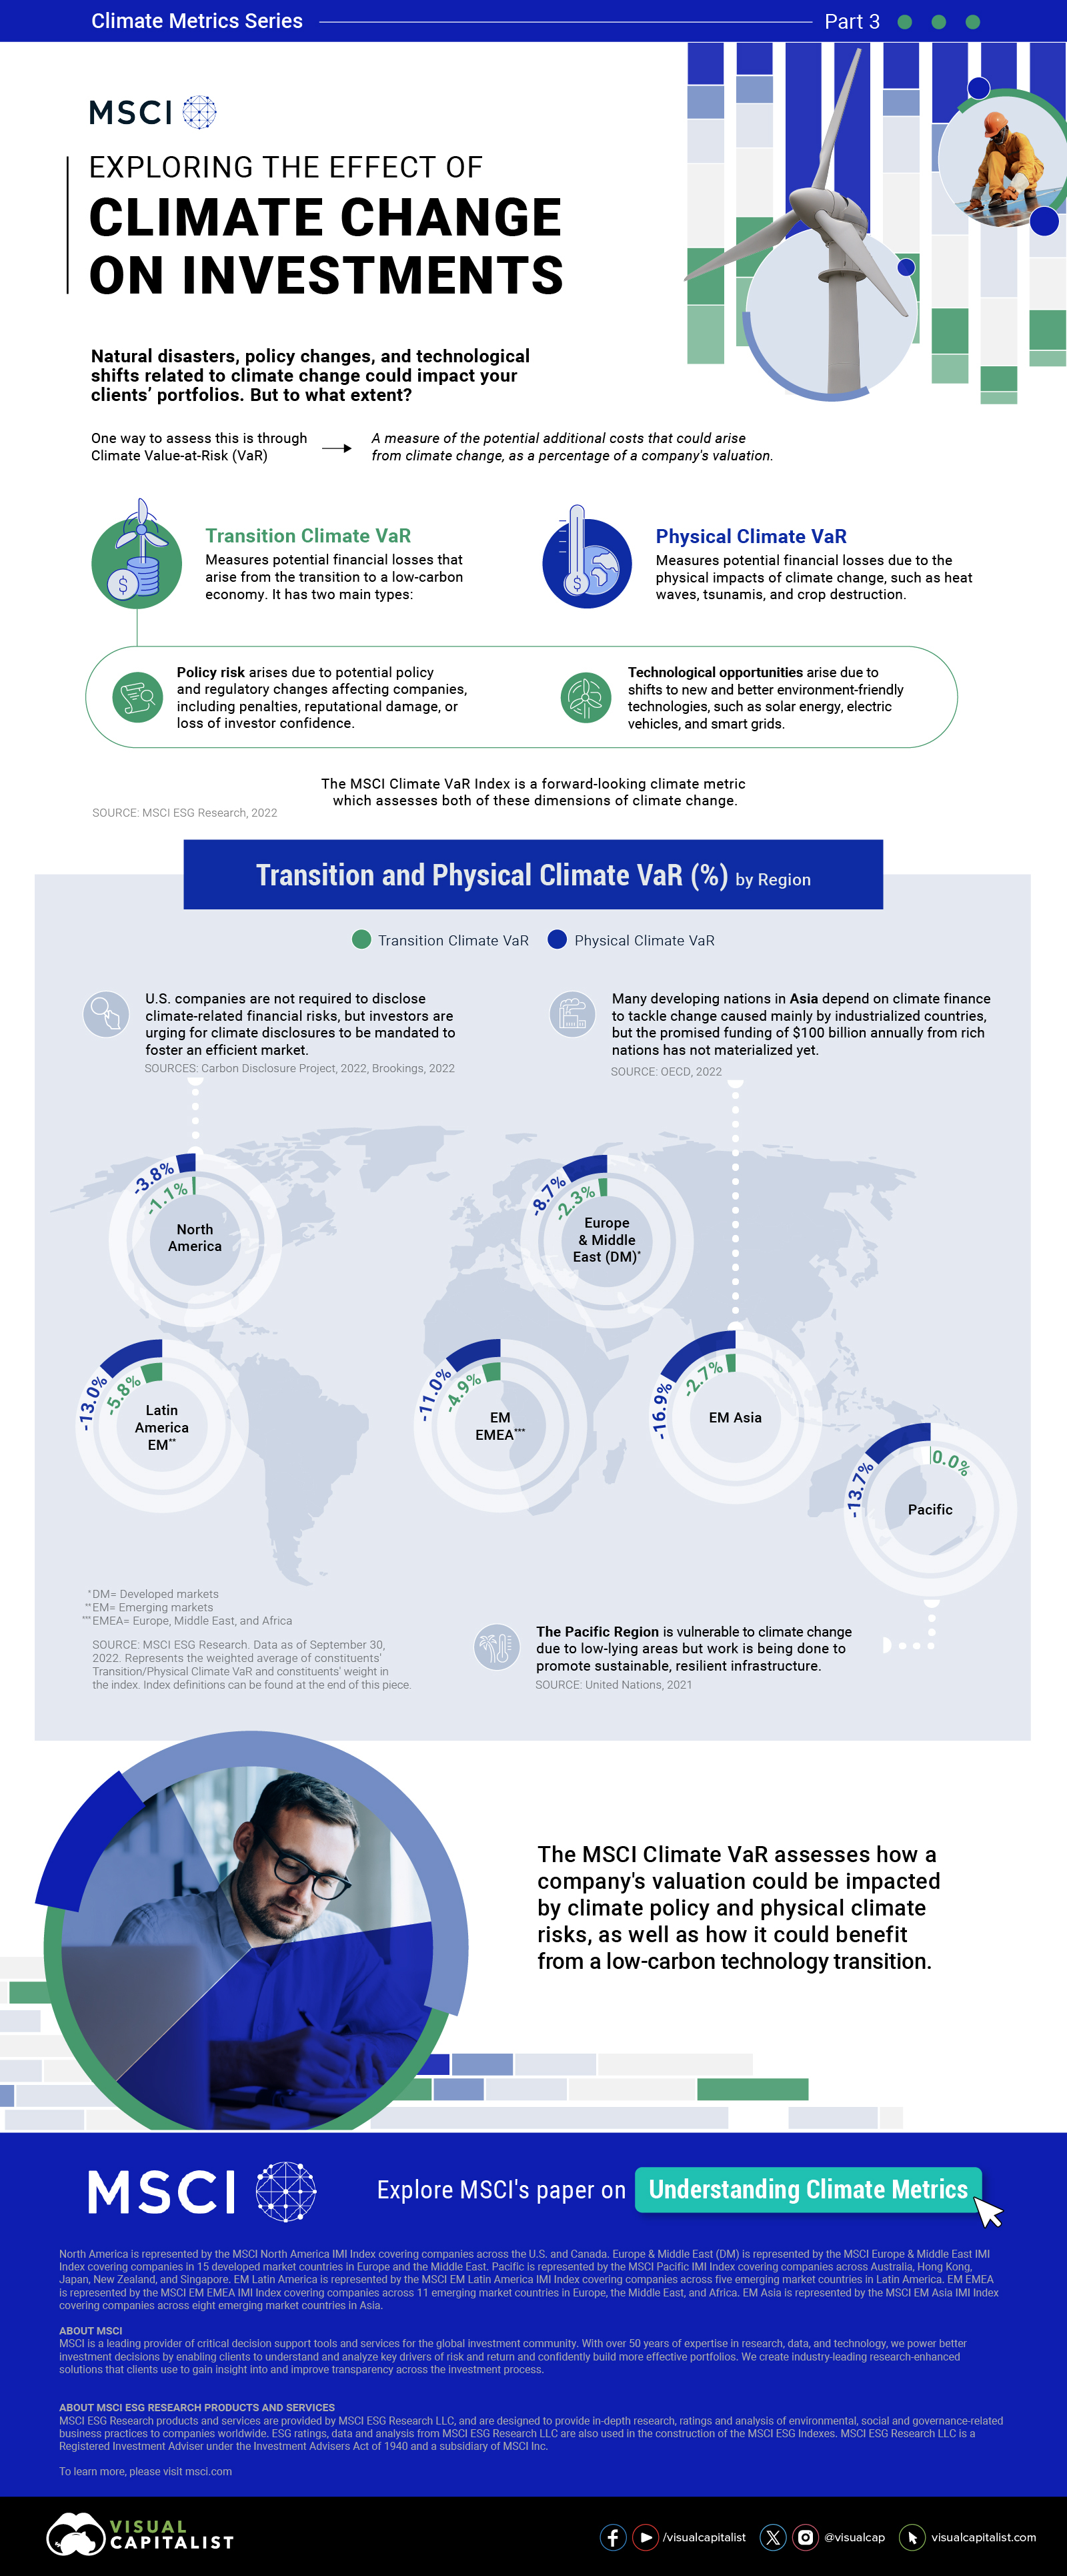
Climate Value-at-Risk (VaR) is a measure of the potential additional costs that could arise from climate change, as a percentage of a company’s valuation, so investors can be better prepared to weather the storm. It assesses two dimensions of climate risk:
1. Transition Climate VaR
This measures potential financial losses from the transition to a low-carbon economy. It has the following categories:
- Policy risk: arises due to potential policy and regulatory changes affecting companies, including penalties, reputational damage, or loss of investor confidence.
- Technological opportunities: arise due to shifts to new and better environmentally-friendly technologies, such as solar energy, electric vehicles, and smart grids.
2. Physical Climate VaR
This measures potential financial losses due to the physical impacts of climate change, such as heat waves, tsunamis, and crop failures.
For instance, the Pacific region, including Australia and New Zealand, is highly vulnerable to climate change given that it’s home to a number of low-lying islands.
Climate Risk, by Region
Climate risks can vary by region due to a range of factors, from climate policy to climate conditions, including increased likelihood of wildfires or flooding.
Below, we show a regional breakdown of Climate VaR. These represent the weighted average of constituents in the following MSCI indexes as of September 30, 2022. The greater the negative VaR, the greater the potential downside risk.
| Region | Transition Climate VaR | Physical Climate VaR |
|---|---|---|
| Europe & Middle East (DM)* | -2.3% | -8.7% |
| EM** Asia | -2.7% | -16.9% |
| EM EMEA*** | -4.9% | -11.0% |
| EM Latin America | -5.8% | -13.0% |
| North America | -1.1% | -3.8% |
| Pacific | +0.0% | -13.7% |
*Developed markets. **Emerging markets. ***Europe, Middle East, and Africa. Pacific region countries include Australia, Hong Kong, Japan, New Zealand and Singapore.
Given how climate risks have the potential to affect a portfolio’s value, it pays to be proactive. The MSCI Climate VaR assesses how a company’s valuation could be impacted by climate policy and physical climate risks, as well as how it could benefit from a low-carbon technology transition.
Explore MSCI’s paper on Understanding Climate Metrics.

-

 Green5 days ago
The Carbon Footprint of Major Travel Methods
Going on a cruise ship and flying domestically are the most carbon-intensive travel methods.
-

 Green2 weeks ago
Ranking the Top 15 Countries by Carbon Tax Revenue
This graphic highlights France and Canada as the global leaders when it comes to generating carbon tax revenue.
-

 Green2 weeks ago
Ranked: The Countries With the Most Air Pollution in 2023
South Asian nations are the global hotspot for pollution. In this graphic, we rank the world’s most polluted countries according to IQAir.
-

 Green3 weeks ago
Top Countries By Forest Growth Since 2001
One country is taking reforestation very seriously, registering more than 400,000 square km of forest growth in two decades.
-

 Green4 weeks ago
Ranked: Top Countries by Total Forest Loss Since 2001
The country with the most forest loss since 2001 lost as much forest cover as the next four countries combined.
-

 Agriculture2 months ago
The World’s Top Cocoa Producing Countries
Here are the largest cocoa producing countries globally—from Côte d’Ivoire to Brazil—as cocoa prices hit record highs.