Visualized: An Investor’s Carbon Footprint, by Sector


Visualized: An Investor’s Carbon Footprint, by Sector
In the quest for a sustainable future, investors can play a crucial role in shaping our planet’s destiny.
Understanding the carbon emissions in different sectors is a key way to make environmentally and financially conscious decisions and help make a positive impact on the planet.
This infographic, sponsored by MSCI, looks at carbon emissions by sector.
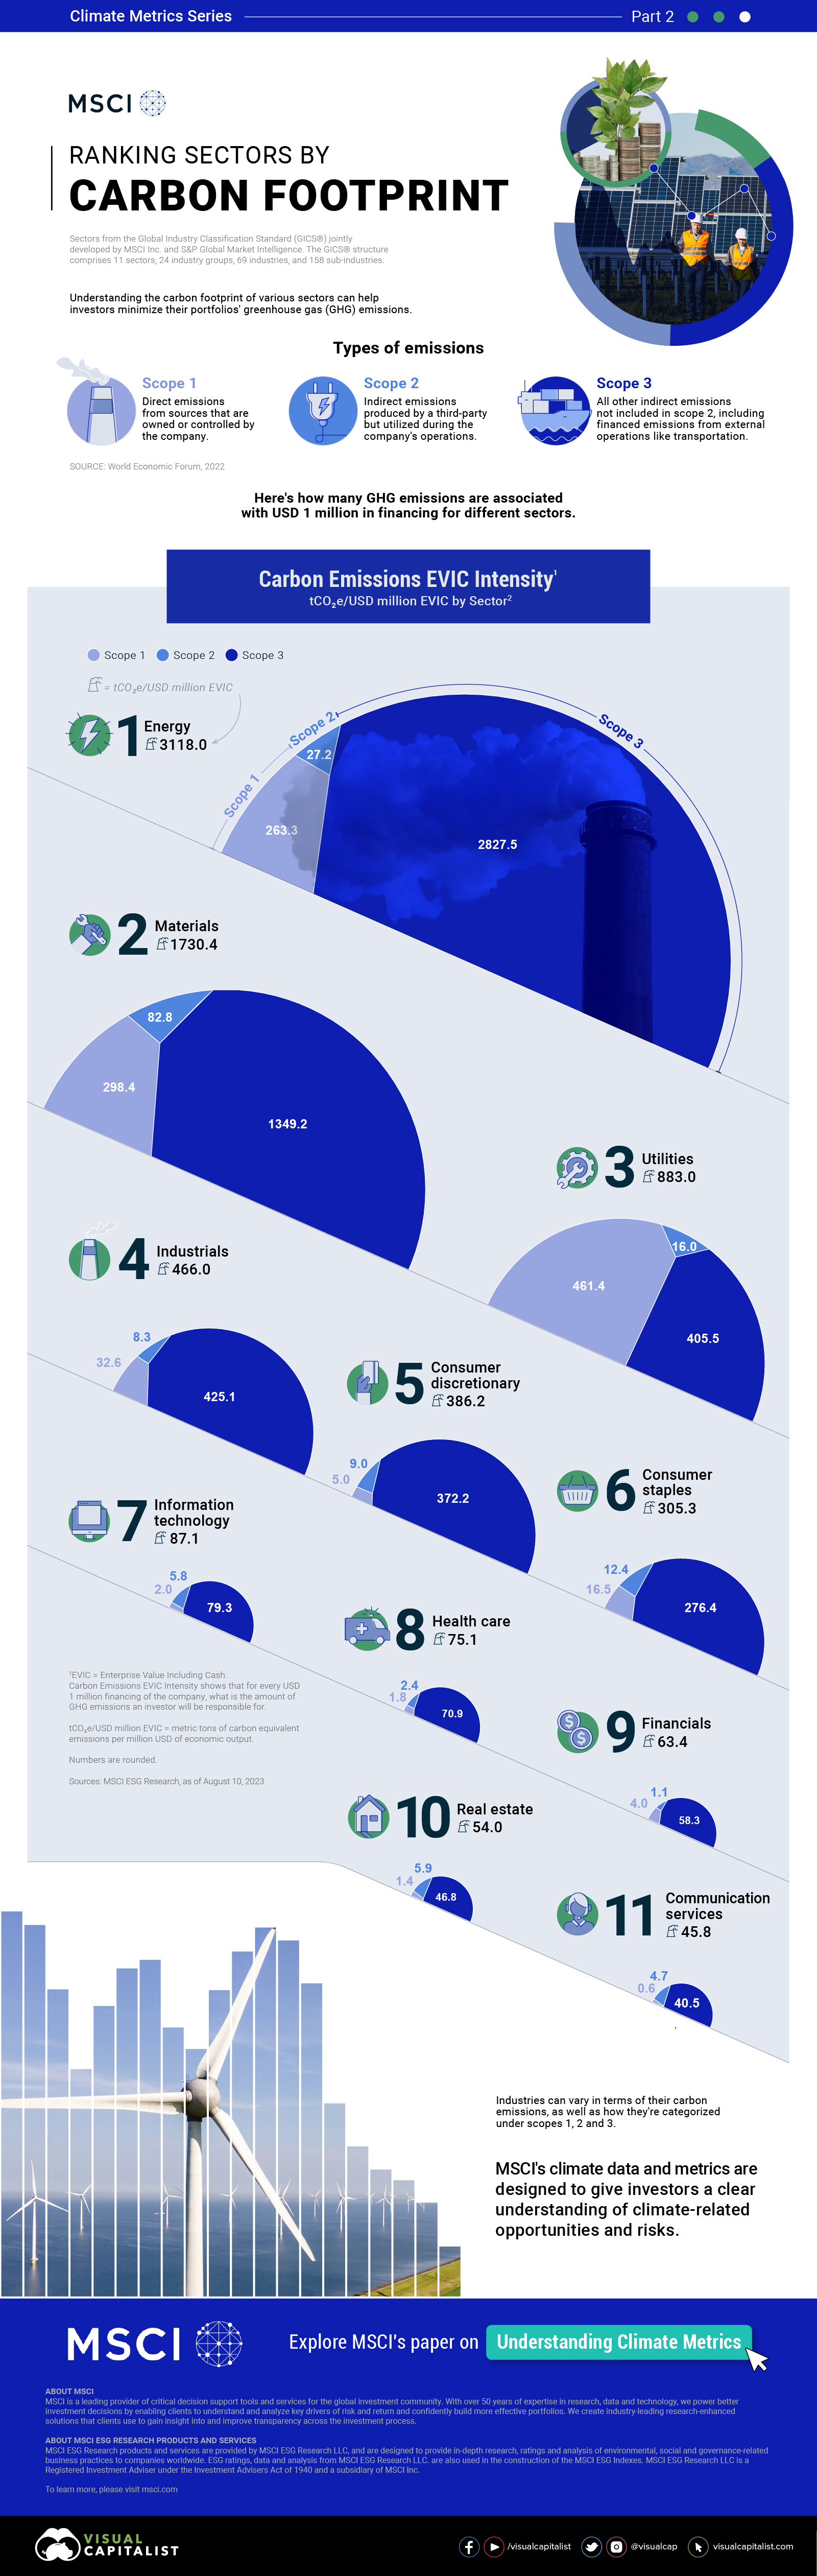
Types of Carbon Emissions
Unsurprisingly, industries heavily reliant on fossil fuels and energy-intensive processes, like energy, materials, and industrials, have significant carbon footprints. In contrast, service-based and technology industries are traditionally less carbon-intensive.
To get an accurate picture of a sector/industry’s carbon footprint, it’s important to look up and down their value chain. Here is how policymakers categorize carbon emissions:
- Scope 1: Generated directly by the organization and within its control e.g., on-site fuel combustion and internal industrial processes.
- Scope 2: Indirect emissions from energy use, such as purchased electricity, heat, or cooling.
- Scope 3: Indirect emissions, but different from Scope 2 emissions. These are emissions that the company does not directly control such as the emissions produced from a supplier or emissions generated from the use of its sold product.
Only looking at all three scopes of emissions can we arrive at a complete picture of a sector’s carbon footprint.
Volume of Carbon Emissions, by Sector
The following table breaks down the greenhouse gas emissions for each sector by scope. A sector’s carbon footprint is expressed in metric tons of CO2 equivalent for every $1 million in financing.
In other words, here’s how much of a climate impact a one million dollar investment has in each of the following sectors.
The total figure represents the weighted average carbon emissions of each sector’s constituents as of August 10, 2023:
| Sector | Scope 1 | Scope 2 | Scope 3 | Total |
|---|---|---|---|---|
| Energy | 263.3 | 27.2 | 2827.5 | 3118.0 |
| Materials | 298.4 | 82.8 | 1349.2 | 1730.4 |
| Utilities | 461.4 | 16.0 | 405.5 | 883.0 |
| Industrials | 32.6 | 8.3 | 425.1 | 466.0 |
| Consumer discretionary | 5.0 | 9.0 | 372.2 | 386.2 |
| Consumer staples | 16.5 | 12.4 | 276.4 | 305.3 |
| Information technology | 2.0 | 5.8 | 79.3 | 87.1 |
| Health care | 1.8 | 2.4 | 70.9 | 75.1 |
| Financials | 4.0 | 1.1 | 58.3 | 63.4 |
| Real estate | 1.4 | 5.9 | 46.8 | 54.0 |
| Communication services | 0.6 | 4.7 | 40.5 | 45.8 |
Represented by tCO₂e/USD million EVIC. EVIC is the enterprise value including cash.
Understanding carbon footprint profiles can help investors evaluate the risks faced by carbon-intensive industries, such as future regulations and reputational challenges.
MSCI’s climate metrics empower investors to make responsible investments and drive meaningful change.
Download MSCI’s Climate Metrics Report.

-

 Green6 days ago
The Carbon Footprint of Major Travel Methods
Going on a cruise ship and flying domestically are the most carbon-intensive travel methods.
-

 Green2 weeks ago
Ranking the Top 15 Countries by Carbon Tax Revenue
This graphic highlights France and Canada as the global leaders when it comes to generating carbon tax revenue.
-

 Green2 weeks ago
Ranked: The Countries With the Most Air Pollution in 2023
South Asian nations are the global hotspot for pollution. In this graphic, we rank the world’s most polluted countries according to IQAir.
-

 Green3 weeks ago
Top Countries By Forest Growth Since 2001
One country is taking reforestation very seriously, registering more than 400,000 square km of forest growth in two decades.
-

 Green4 weeks ago
Ranked: Top Countries by Total Forest Loss Since 2001
The country with the most forest loss since 2001 lost as much forest cover as the next four countries combined.
-

 Agriculture2 months ago
The World’s Top Cocoa Producing Countries
Here are the largest cocoa producing countries globally—from Côte d’Ivoire to Brazil—as cocoa prices hit record highs.