Economic Coercion: China’s Leverage in Trade


Economic Coercion: China’s Leverage in Trade
China’s rise as a global economic superpower has brought with it an ability for the nation to utilize its economic dominance for geopolitical purposes.
In this infographic sponsored by The Hinrich Foundation, we explore China’s dominant position in the solar photovoltaic (PV) supply chain, and how this could be used as leverage against countries that are dependent on it for clean energy.
Dominance in the Solar Supply Chain
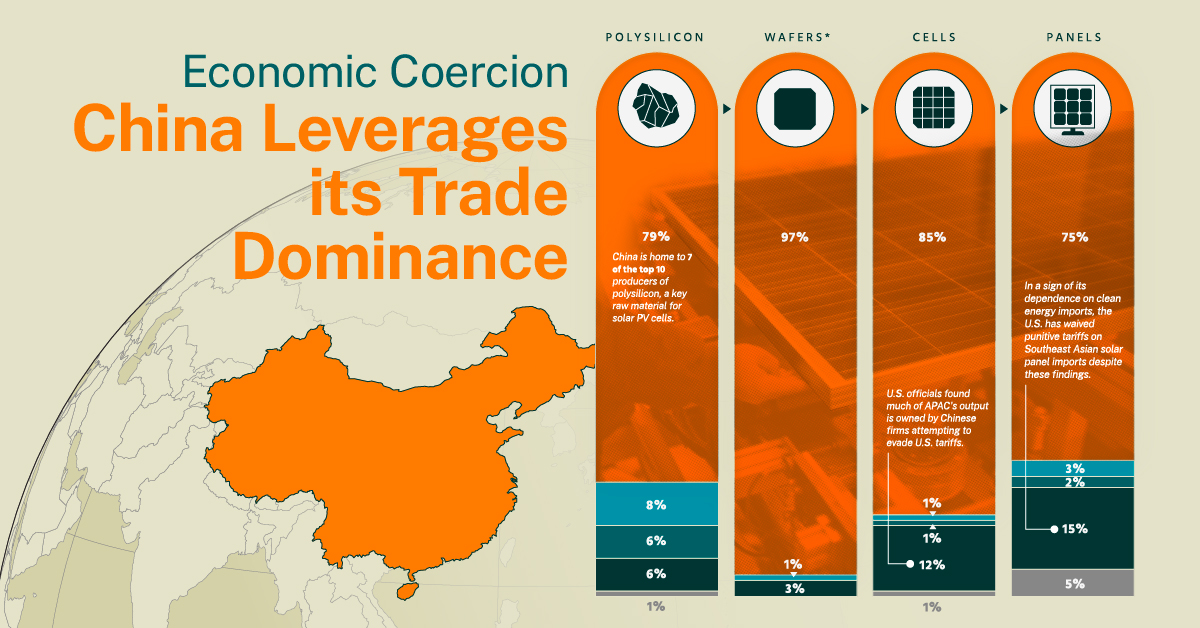
Solar energy is playing a significant role in the green energy transition, and as this infographic shows, China’s dominance in the sector is clear.
| Economy | Polysilicon | Wafers | Cells | Panels |
|---|---|---|---|---|
| China | 79% | 97% | 85% | 75% |
| Europe | 8% | 1% | 1% | 3% |
| North America | 6% | 0% | 1% | 2% |
| APAC | 6% | 3% | 12% | 15% |
| Rest of World | 1% | 0% | 1% | 5% |
The solar PV supply chain starts with polysilicon, a key raw material needed to create wafers. China is home to seven of the top 10 producers of polysilicon, which includes companies like Tongwei Solar and Asia Silicon.
Where China is most dominant though, is in the manufacturing of wafers and cells. This is partly because it’s more economical to make these components close to wherever polysilicon is being produced.
The second-largest producer of cells and panels is the APAC region (ex-China), at 12% and 15% of total capacity. However, according to U.S. officials, much of this output is actually owned by Chinese firms attempting to evade U.S. tariffs.
While these companies would normally be subject to higher tariffs, the Biden administration has paused any tariff increases for the next two years. This can be interpreted as a sign of the country’s dependence on China for clean energy infrastructure, which could prove problematic given China’s history of economic coercion.
Leveraging Trade for Geopolitical Purposes
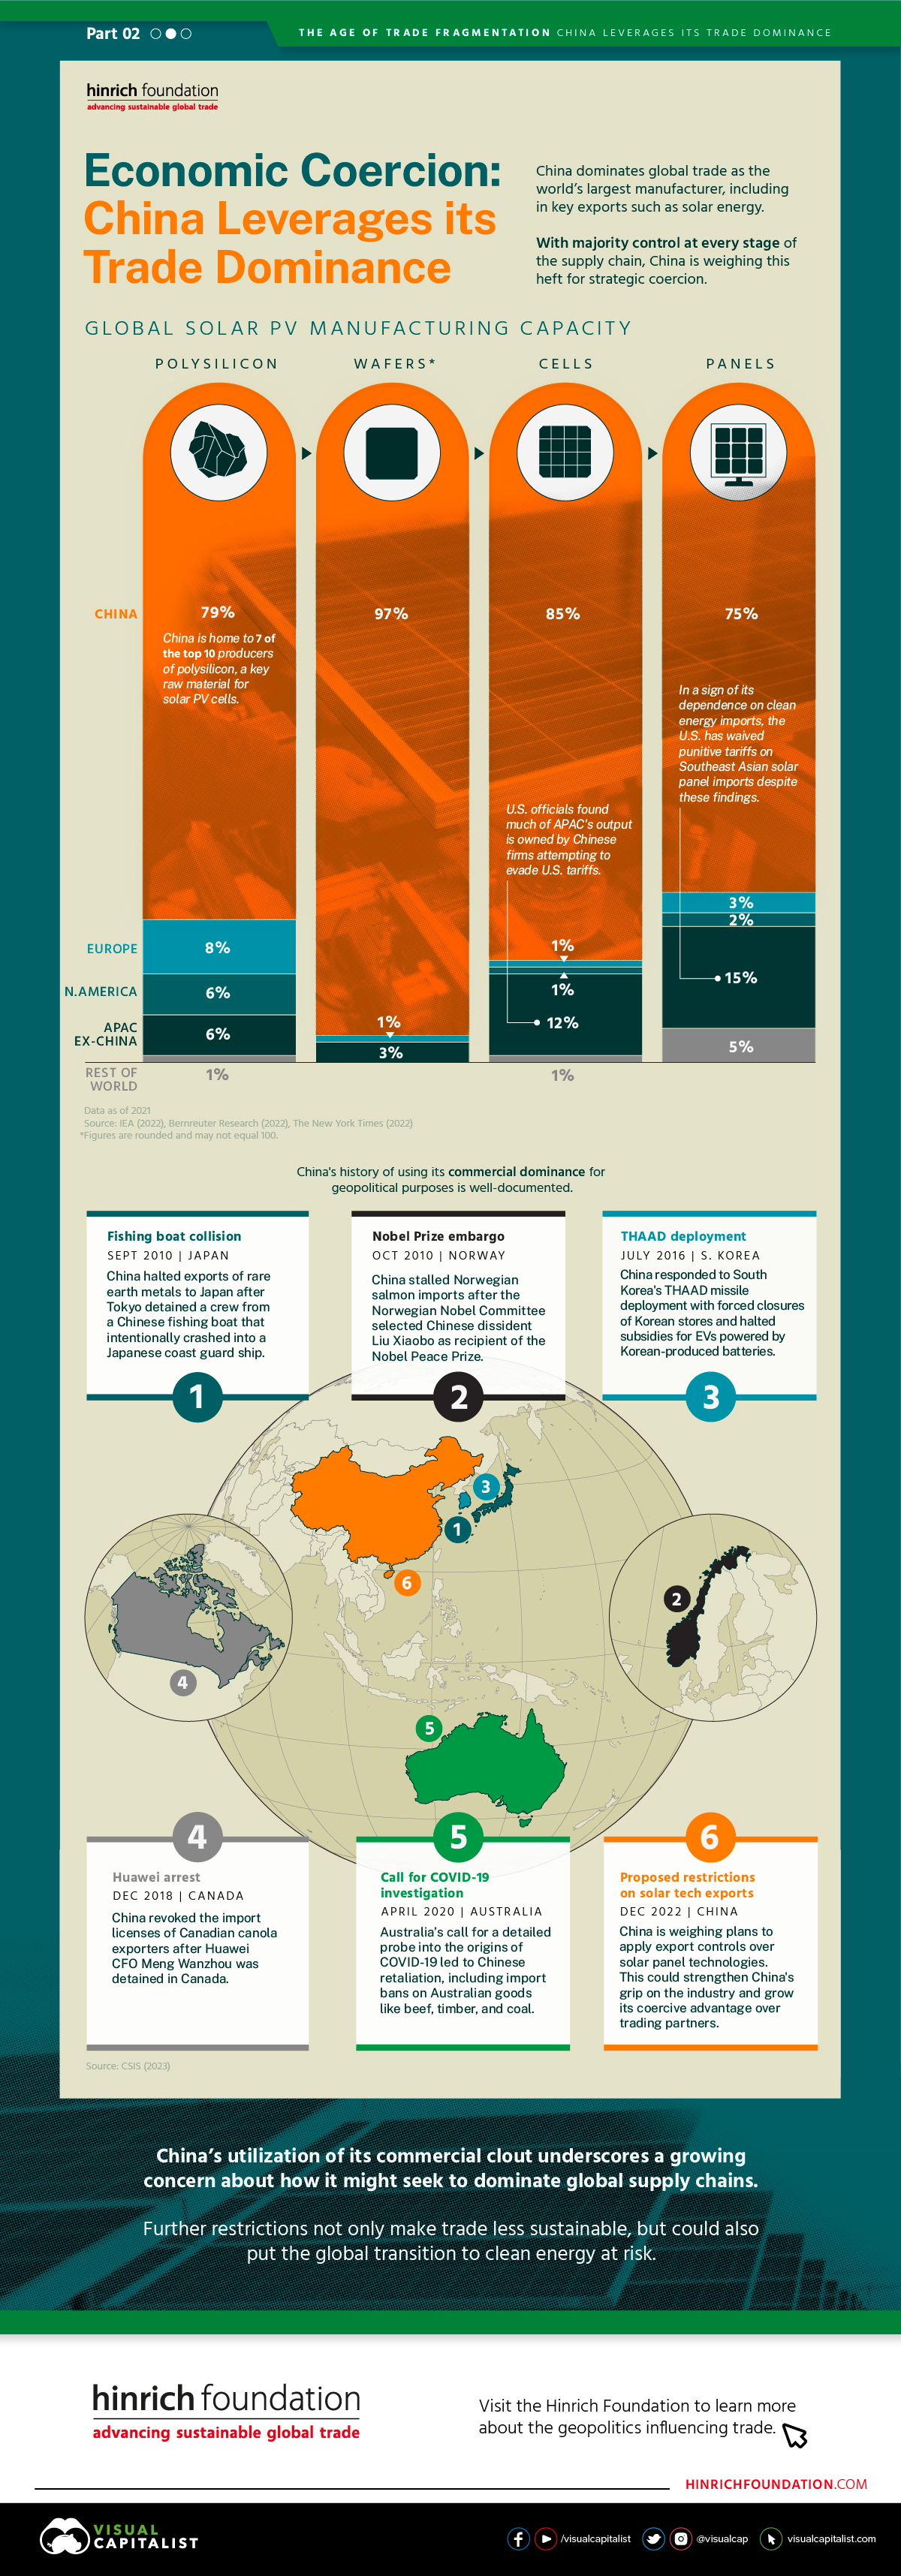
The second part of this infographic highlights past instances where China has used its commercial dominance for geopolitical purposes.
For example, in October 2010, the Norwegian Nobel Committee awarded the Nobel Peace Prize to Liu Xiaobo, a jailed Chinese dissident. China began stalling Norwegian salmon imports in response, and Norway’s market share of salmon exports to China fell from 92% in 2010, to 29% in 2013, according to the Financial Times.
China took similar actions towards Australia in April 2020 after the island nation called for a detailed probe into the origins of COVID-19. Import bans on Australian goods like beef, timber, and coal were announced in retaliation. These restrictions were eventually lifted in May 2023.
Given the massive size of China’s economy, import bans such as these can heavily impact a trading partner’s industries.
More recently, China announced in December 2022 that it would be looking into new export controls over solar panel technologies. Given China’s already tight grip over the solar PV industry, this move could expand the nation’s playbook when it comes to economic coercion.
This graphic is the second in a three-part series by The Hinrich Foundation that covers the geopolitics of trade.

-

 Misc3 hours ago
Visualizing the Most Common Pets in the U.S.
Lions, tigers, and bears, oh my!—these animals do not feature on this list of popular American household pets.
-

 Economy3 days ago
Economic Growth Forecasts for G7 and BRICS Countries in 2024
The IMF has released its economic growth forecasts for 2024. How do the G7 and BRICS countries compare?
-

 United States2 weeks ago
Ranked: The Largest U.S. Corporations by Number of Employees
We visualized the top U.S. companies by employees, revealing the massive scale of retailers like Walmart, Target, and Home Depot.
-

 Economy2 weeks ago
Where U.S. Inflation Hit the Hardest in March 2024
We visualized product categories that saw the highest % increase in price due to U.S. inflation as of March 2024.
-

 Economy1 month ago
G20 Inflation Rates: Feb 2024 vs COVID Peak
We visualize inflation rates across G20 countries as of Feb 2024, in the context of their COVID-19 pandemic peak.
-

 Economy1 month ago
Mapped: Unemployment Claims by State
This visual heatmap of unemployment claims by state highlights New York, California, and Alaska leading the country by a wide margin.