Visualizing the Impact of the G20’s Corporate Subsidies


Visualizing the Impact of the G20’s Corporate Subsidies
Corporate subsidies refer to financial incentives provided by governments to domestic businesses.
These incentives aim to promote economic growth within a specific industry, and can take various forms such as direct crash grants, tax breaks, low-interest loans, or favorable regulations. While corporate subsidies can have positive effects on a country’s economy, they can also create an uneven playing field in the global market.
This graphic from the Hinrich Foundation visualizes the impact of the G20’s use of corporate subsidies, from 2008 to Q1 2023.
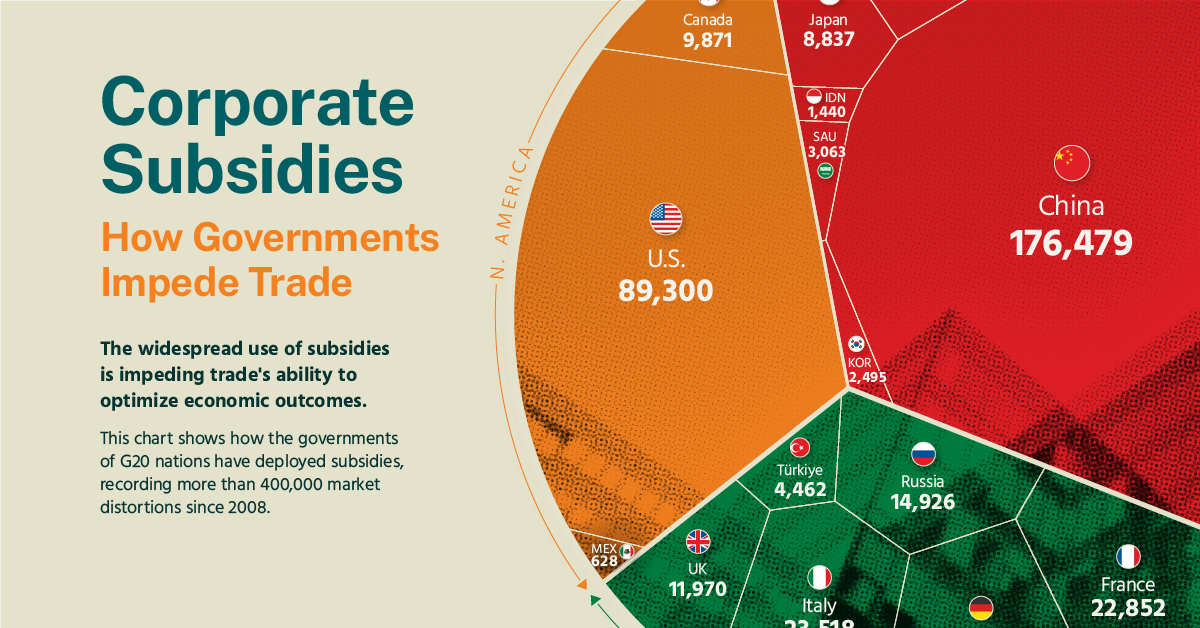
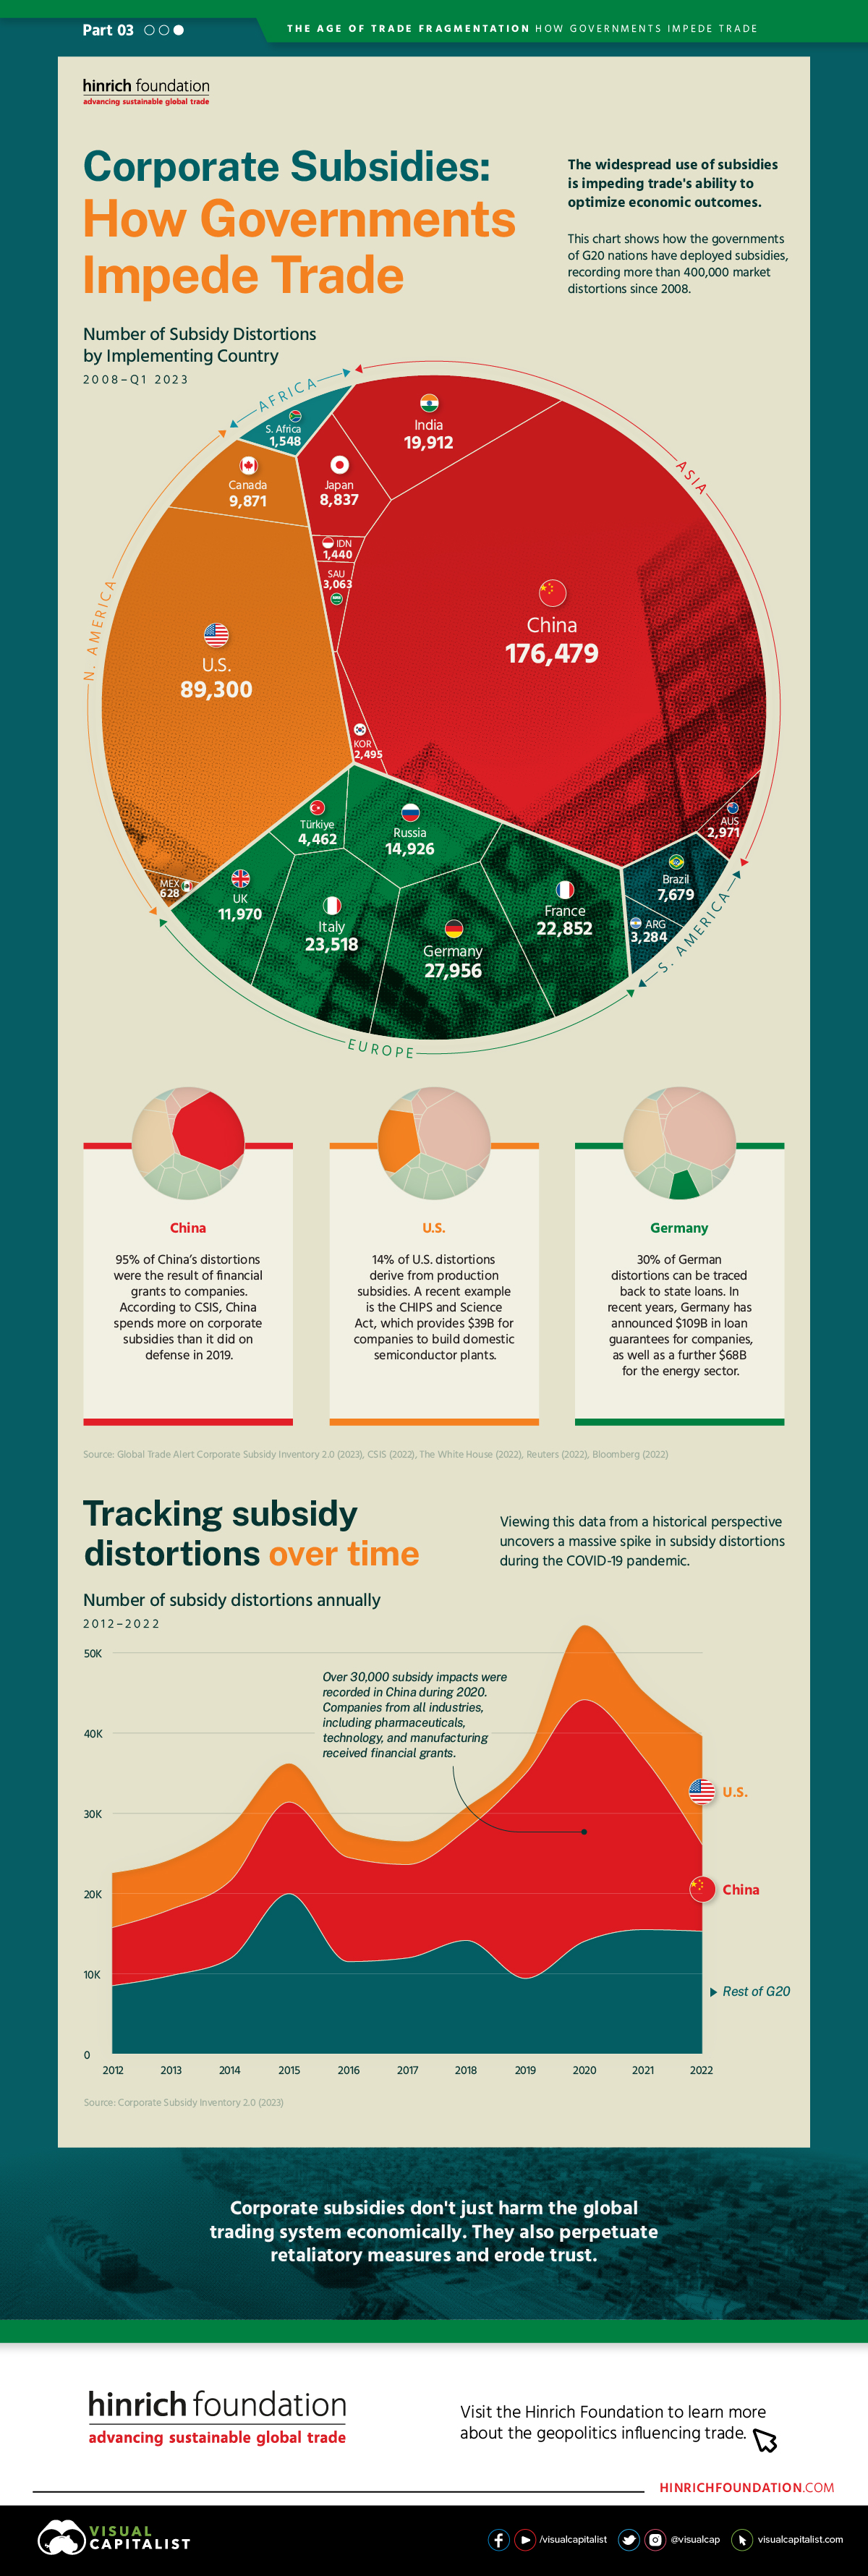
Number of Subsidy Distortions by Implementing Country
The following table includes all of the data we used to create the first chart in this graphic, which was sourced from Global Trade Alert’s Corporate Subsidy Inventory.
A key point to understand is that this data does not represent the number of subsidies implemented by each country. Rather, it shows the number of market distortions that resulted as a consequence of those subsidies.
| Country | Number of Subsidy Distortions |
|---|---|
| 🇨🇳 China | 176,479 |
| 🇺🇸 US | 89,300 |
| 🇩🇪 Germany | 27,956 |
| 🇮🇹 Italy | 23,518 |
| 🇫🇷 France | 22,852 |
| 🇮🇳 India | 19,912 |
| 🇷🇺 Russia | 14,926 |
| 🇬🇧 UK | 11,970 |
| 🇨🇦 Canada | 9,871 |
| 🇯🇵 Japan | 8,837 |
| 🇧🇷 Brazil | 7,679 |
| 🇹🇷 Turkey | 4,462 |
| 🇦🇷 Argentina | 3,284 |
| 🇸🇦 Saudi Arabia | 3,063 |
| 🇦🇺 Australia | 2,971 |
| 🇰🇷 South Korea | 2,495 |
| 🇿🇦 South Africa | 1,548 |
| 🇮🇩 Indonesia | 1,440 |
| 🇲🇽 Mexico | 628 |
As we can see, China and the U.S. account for a massive chunk of the G20’s subsidy-related market distortions between 2008 and Q1 2023. According to CSIS, China spent more on corporate subsidies than it did on defense in 2019. Of the country’s 176,479 market distortions, approximately 95% have stemmed from the use of financial grants.
China has a long history of providing substantial financial aid to its major companies. This includes Huawei, which became a global leader in 5G networks despite being founded just 35 years ago in 1987. A 2019 story from The Wall Street Journal found that Huawei had benefited from as much as $75 billion in government aid.
Turning focus to the U.S., the largest sources of its market distortions were financial grants (16%), state loans (15%), and production subsidies (14%).
A recent example of American subsidies is the Biden administration’s CHIPS and Science Act, which provides $39 billion in aid to boost domestic chip making, as well as billions more to support the semiconductor industry as a whole.
Tracking Subsidy Distortions Over Time
The second chart in this graphic visualizes the annual number of subsidy-related market distortions recorded between 2012 and 2022. It highlights a massive spike in activity during the onset of the COVID-19 pandemic in 2020.
China was the largest player during this time, with over 30,000 market distortions recorded throughout the year. Companies from all industries, including pharmaceuticals, technology, and manufacturing received financial grants.
This graphic is the conclusion to a three-part series that covers the geopolitics of trade.
Visit the Hinrich Foundation to learn more about the geopolitics influencing trade

-

 Economy5 days ago
VC+: Get Our Key Takeaways From the IMF’s World Economic Outlook
A sneak preview of the exclusive VC+ Special Dispatch—your shortcut to understanding IMF’s World Economic Outlook report.
-

 Economy2 months ago
How Do Democrats and Republicans Feel About Certain U.S. Industries?
A survey looked at U.S. industry favorability across political lines, showing where Democrats and Republicans are divided over the economy.