Ranking the Trade Policies of the G20


Ranking the Trade Policies of the G20
In October 2021, the leaders of the G20 nations met for their annual summit in Rome. On the agenda were important items such as climate change, corporate taxation, and of course, the issue of global trade.
Altogether, the G20 represents 85% of global GDP and 66% of the world’s population. It is therefore important to track their trade policy regimes, as they have a significant impact on growth and development.
With this in mind, The Hinrich Foundation has analyzed the policy interventions of every G20 member following the Rome summit to see how global protectionism has advanced.
Liberalizing vs. Harmful Interventions
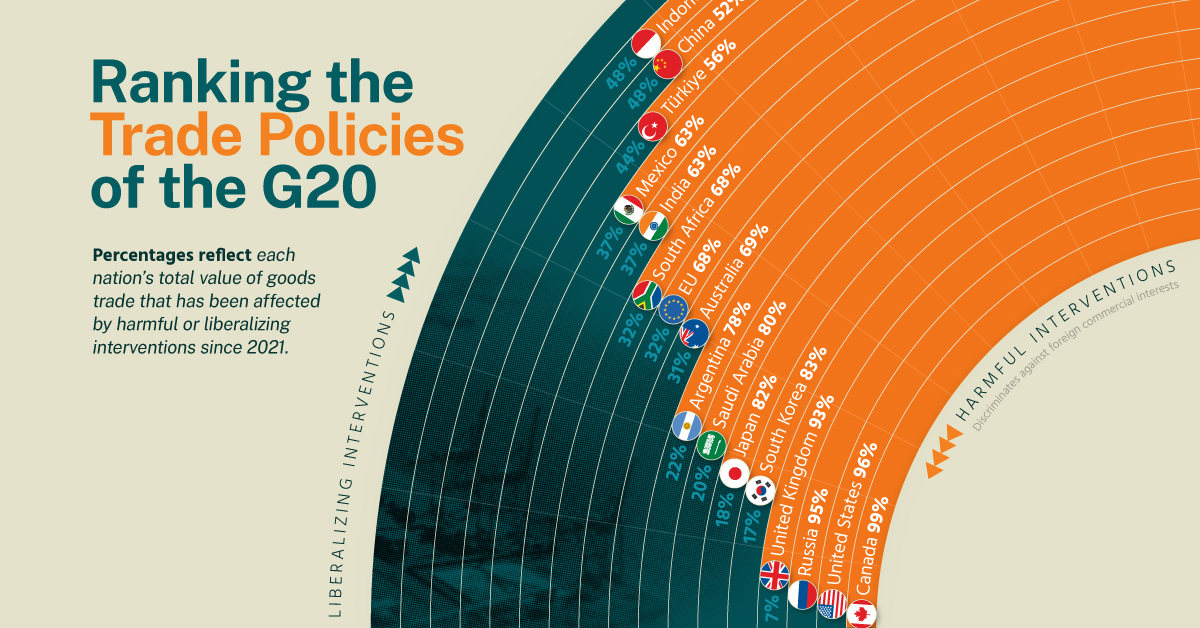
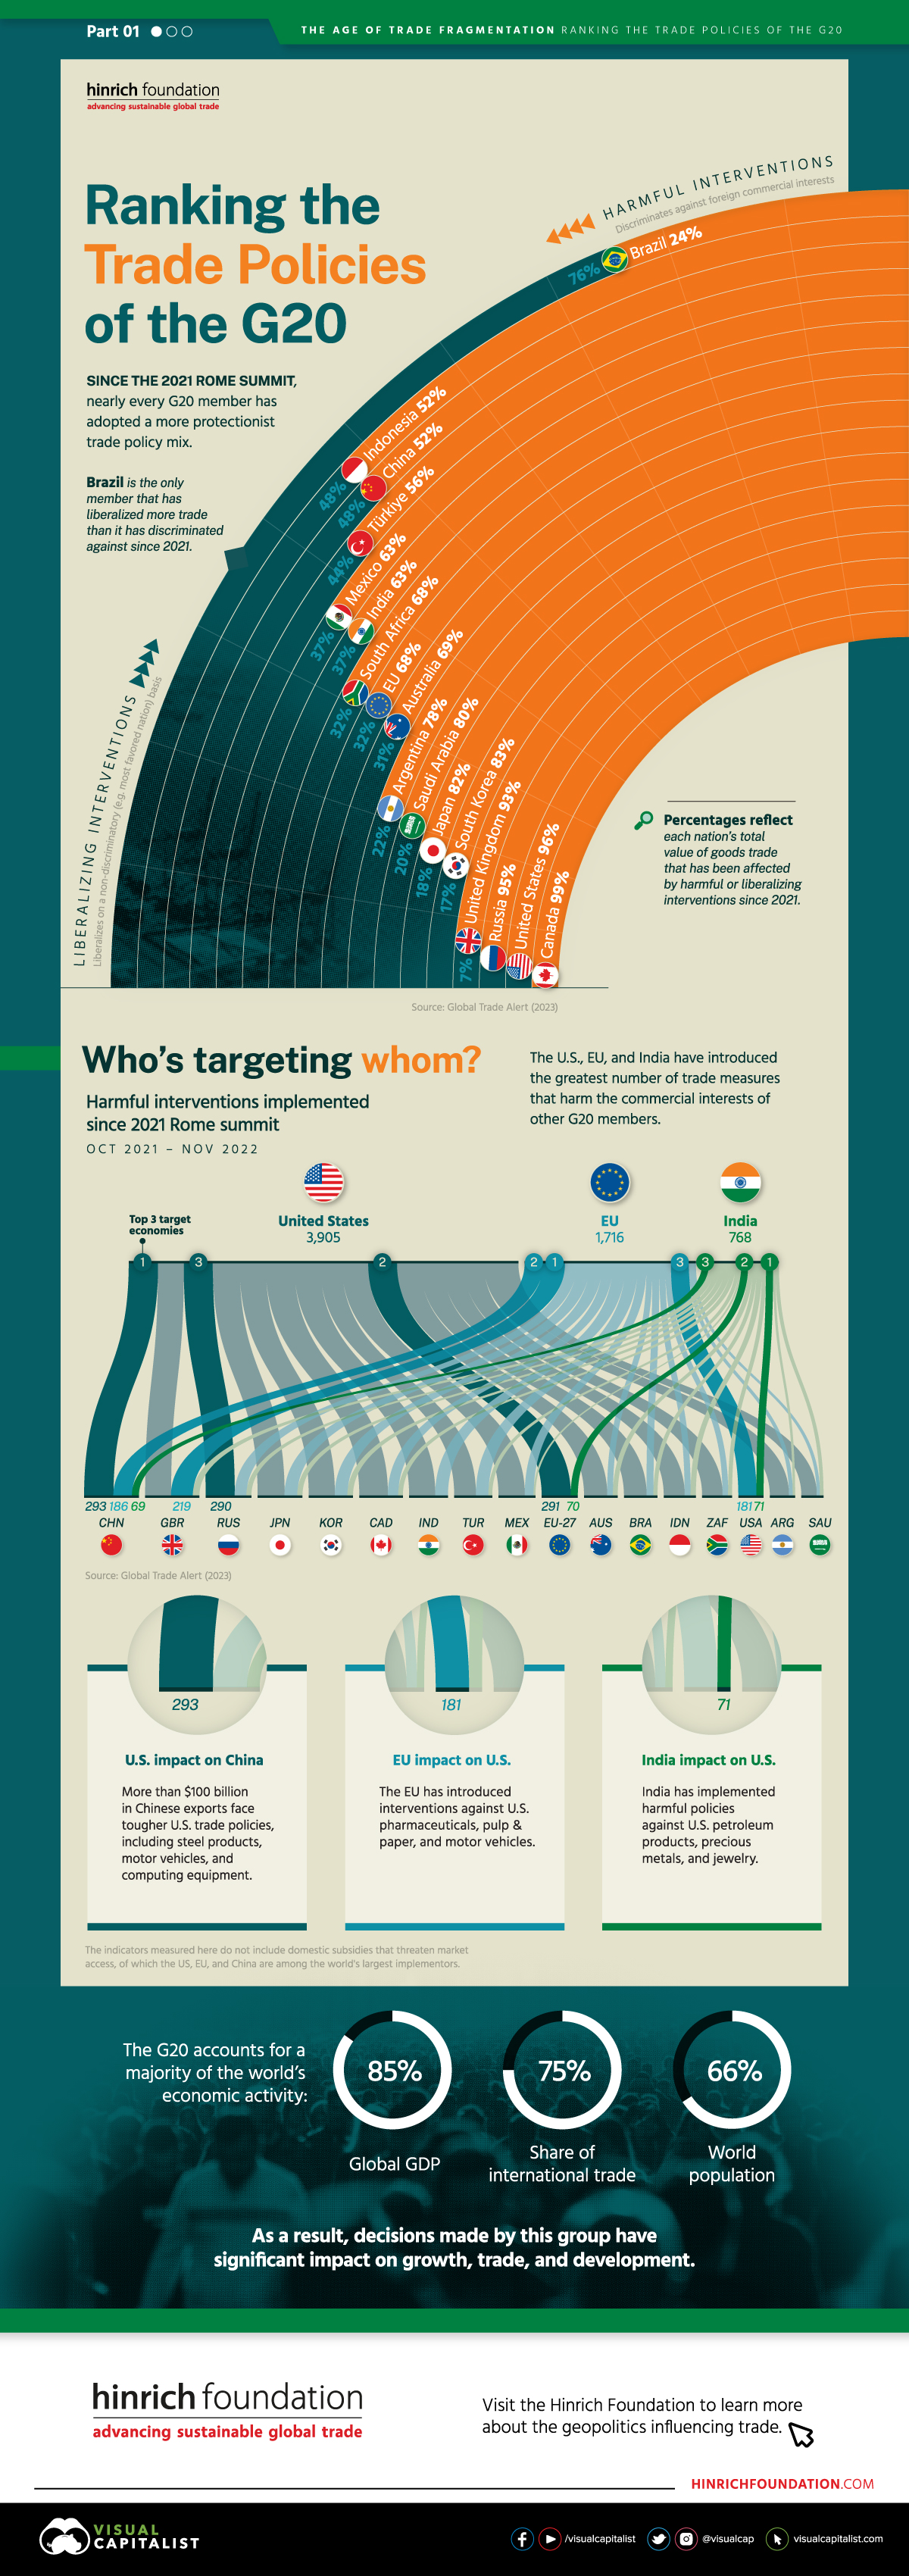
The first chart in this infographic measures the percentage of each nation’s total value of goods trade that has been affected by harmful or liberalizing interventions.
We define liberalizing interventions as those that liberalize on a non-discriminatory or most favored nation basis. On the other hand, harmful interventions are those that discriminate against the commercial interests of a foreign country.
From this data we can see that Brazil is the only G20 member to have liberalized more trade than it discriminated against.
Note that our data only includes 17 economies. This is because the G20 includes France, Germany, and Italy, while our dataset aggregates them under EU.
| G20 Member | % Liberalizing | % Harmful |
|---|---|---|
| 🇧🇷 Brazil | 76% | 24% |
| 🇮🇩 Indonesia | 48% | 52% |
| 🇨🇳 China | 48% | 52% |
| 🇹🇷 Türkiye | 44% | 56% |
| 🇲🇽 Mexico | 37% | 63% |
| 🇮🇳 India | 37% | 63% |
| 🇿🇦 South Africa | 32% | 68% |
| 🇪🇺 EU | 32% | 68% |
| 🇦🇺 Australia | 31% | 69% |
| 🇦🇷 Argentina | 22% | 78% |
| 🇸🇦 Saudi Arabia | 20% | 80% |
| 🇯🇵 Japan | 18% | 82% |
| 🇰🇷 South Korea | 17% | 83% |
| 🇬🇧 UK | 7% | 93% |
| 🇷🇺 Russia | 5% | 95% |
| 🇺🇸 US | 4% | 96% |
| 🇨🇦 Canada | 1% | 99% |
Based on the trade policies enacted between the Rome Summit (Oct 2021) and the Bali Summit (Nov 2022). Source: Global Trade Alert (2022)
Across the rest of the G20, the majority of goods trade was subject to harmful trade policies. This could include import tariffs, state subsidies for domestic industries, and even outright bans.
Who’s Targeting Whom?
Turning focus to the number of harmful trade measures introduced, we can identify the U.S., EU, and India as the top three implementers. The full list is included below.
| Country | Number of harmful interventions |
|---|---|
| 🇺🇸 United States of America | 3,905 |
| 🇪🇺 EU | 1,716 |
| 🇮🇳 India | 768 |
| 🇧🇷 Brazil | 697 |
| 🇷🇺 Russia | 644 |
| 🇦🇺 Australia | 304 |
| 🇦🇷 Argentina | 264 |
| 🇹🇷 Türkiye | 223 |
| 🇮🇩 Indonesia | 217 |
| 🇯🇵 Japan | 171 |
| 🇨🇦 Canada | 141 |
| 🇬🇧 United Kingdom | 137 |
| 🇸🇦 Saudi Arabia | 101 |
| 🇰🇷 South Korea | 79 |
| 🇿🇦 South Africa | 60 |
| 🇲🇽 Mexico | 54 |
| 🇨🇳 China | 38 |
The top three target economies of the U.S. were China (293 measures), the EU (291), and Russia (290). Over $100 billion in Chinese exports such as steel products, motor vehicles, and computing equipment are subject to harmful interventions.
The EU’s top three targets were the UK (219), China (186), and the U.S. (181).
This graphic is the first in a three-part series by The Hinrich Foundation that covers the geopolitics of trade.

-

 War1 month ago
Visualized: Top 15 Global Tank Fleets
Heavily armed and armored, the modern tank is a versatile and mobile weapons platform, and a critical piece of contemporary warfare.
-

 Politics2 months ago
Mapped: 2024 Global Elections by Country
It’s election year around the world, and this map of 2024 global elections by country shows just how many people will be impacted.
-
 Politics2 months ago
Which Countries Meet NATO’s Spending Target?
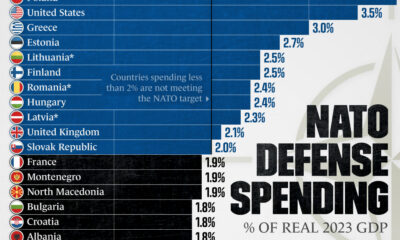
In 2023, only 11 member countries reached NATO’s target of spending 2% of their country’s GDP on defense.
-
 Politics2 months ago
Breaking Down $1.3T in NATO Defense Spending
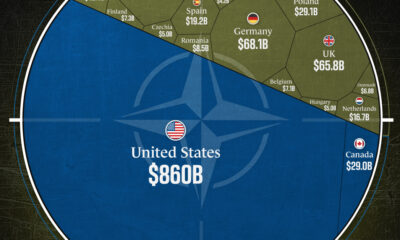
The U.S. accounts for 68% of NATO’s total combined defense spending.
-

 Politics2 months ago
How Do Democrats and Republicans Feel About Certain U.S. Industries?
A survey looked at U.S. industry favorability across political lines, showing where Democrats and Republicans are divided over the economy.
-
 Politics3 months ago
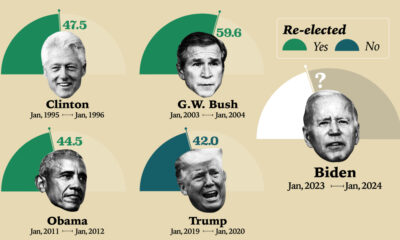
U.S. President Approval Ratings in Their Third Year (1955-2023)
How does Biden’s approval rating stack up against other presidents? This graphic compares presidents across modern history.