Precious Metals
The Silver Series: Who Controls The World’s Supply? (Part 2 of 4)


Silver Series Part 2: Who Controls The World’s Silver?
Within the Earth’s crust, there is 1 gram of silver for every 12.5 tonnes of earth (27,600 lbs). This makes silver very difficult to find. To understand silver supply, we must first discover how economic silver deposits form.
Silver is typically mined as a byproduct in polymetallic deposits with a variety of metals. Other key metals found in these ores include lead, zinc, gold, and copper. These deposits can form in many different ways:
- Volcanogenic Massive Sulphide (VMS) deposits are formed at or near the sea floor by underwater volcanic activity. They can be a significant source of copper, zinc, lead, gold, and silver.
- Carbonate hosted deposits are known specifically as Mississippi Valley and Irish types with limestone and dolomite as the most common host rocks. Zinc-lead content is usually 5-10% with concentrations of silver and copper present.
- Sedimentary exhalative (Sedex) deposits are formed by release of ore-bearing hydrothermal fluids into water, resulting in the precipitation of metals such as lead, zinc, silver, copper, and gold.
- Intrusion related deposits relate to skarns, veins, mantos, high sulphidation, or other related types of deposits. Intrusions are when liquid rock (magma) forms under the Earth’s surface and slowly pushes up into spaces it can find, sometimes pushing country rock away.
- Epithermal deposits are created close to surface and are deposited by hot fluids. These occur typically in areas where magmas are able to move high in the Earth’s crust. Gold, silver, copper, and other metals are found in epithermal deposits.
Silver occurs in many different types of deposits, and in 2013 silver was mined as the primary metal 29% of the time.
The total amount of silver mined in global history is enough to create a 52m cube. The amount of silver available to the market each year depends chiefly on mine production and scrap metal recycling. In 2013, silver scrap reached its lowest levels since 2001 to 5,966 tonnes, or under 20% of supply.
Silver is most often mined from polymetallic deposits. There are different types spread out through the world, but silver supply is increasingly coming from North and South America and primary silver miners.
Don’t miss another part of the Silver Series by connecting with Visual Capitalist to receive daily infographics through e-mail or social media.
This would not be possible without our sponsors: Silver.com and Endeavour Silver


Mining
Visualizing the New Era of Gold Mining
This infographic highlights the need for new gold mining projects and shows the next generation of America’s gold deposits.
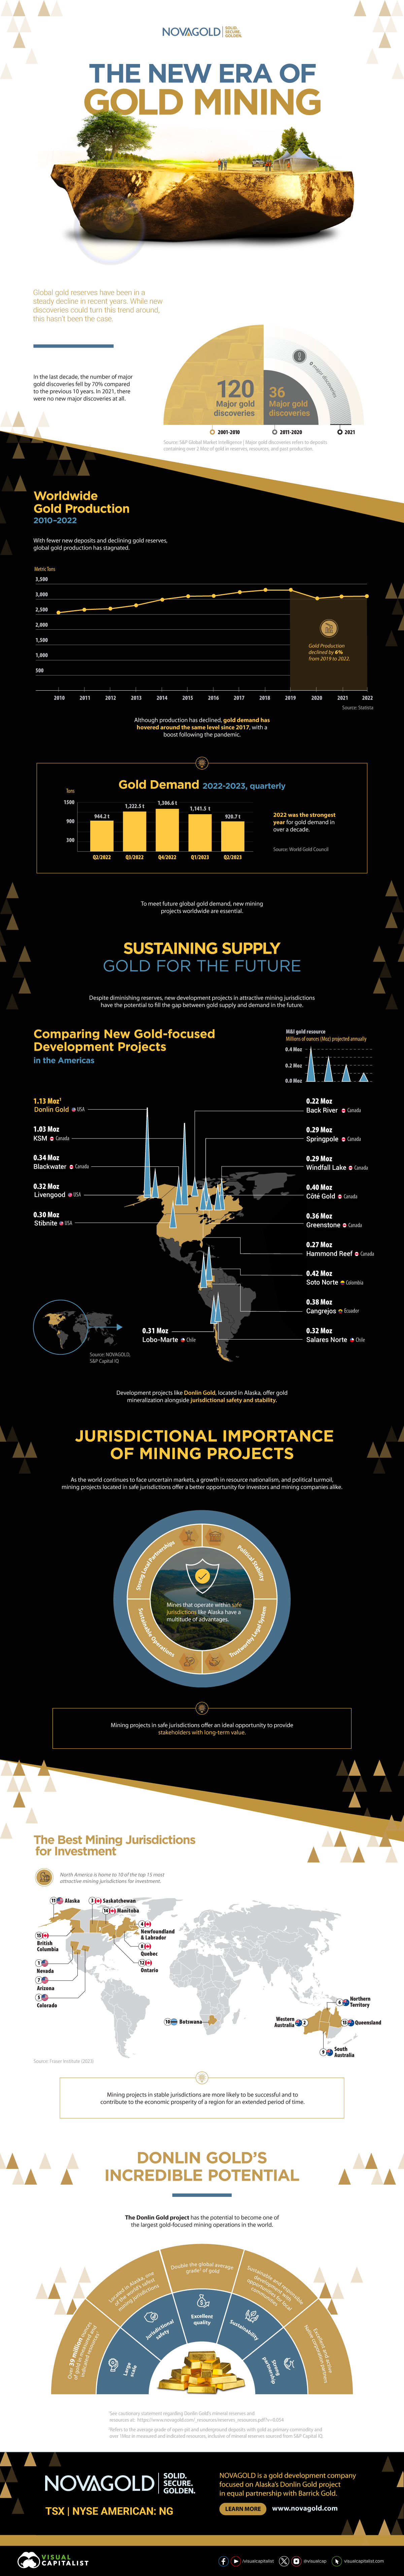
Visualizing the New Era of Gold Mining
Between 2011 and 2020, the number of major gold discoveries fell by 70% relative to 2001-2010.
The lack of discoveries, alongside stagnating gold production, has cast a shadow of doubt on the future of gold supply.
This infographic sponsored by NOVAGOLD highlights the need for new gold mining projects with a focus on the company’s Donlin Gold project in Alaska.
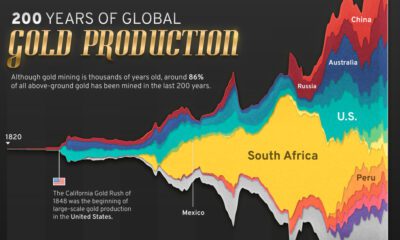
The Current State of Gold Production
Between 2010 and 2019, gold production increased steadily, though this growth has stagnated over the past few years.
| Year | Gold Production, tonnes | YoY % Change |
|---|---|---|
| 2010 | 2,560 | - |
| 2011 | 2,660 | 3.9% |
| 2012 | 2,690 | 1.1% |
| 2013 | 2,800 | 4.1% |
| 2014 | 2,990 | 6.8% |
| 2015 | 3,100 | 3.7% |
| 2016 | 3,110 | 0.3% |
| 2017 | 3,230 | 3.9% |
| 2018 | 3,300 | 2.2% |
| 2019 | 3,300 | 0.0% |
| 2020 | 3,030 | -8.2% |
| 2021 | 3,090 | 2.0% |
| 2022 | 3,100 | 0.3% |
Along with a small decrease in gold production in 2020, there were no new major gold discoveries in 2021.
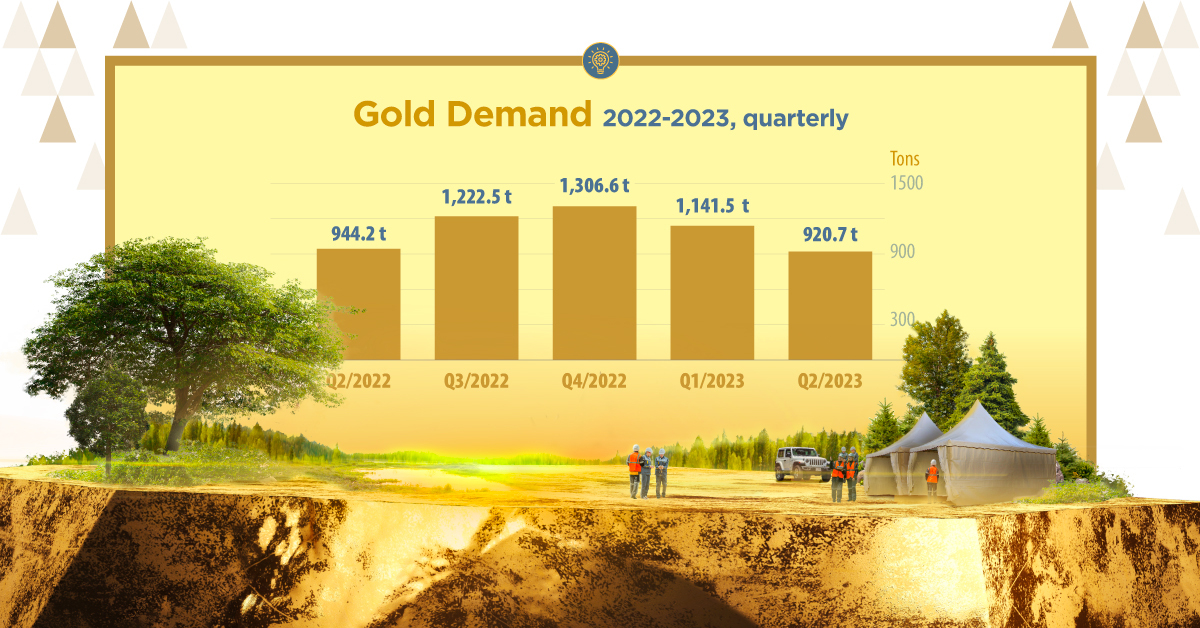
The fall in production and long-term lack of gold discoveries point towards a possible imbalance in gold supply and demand. This calls for the introduction of new gold development projects that can fill the supply-demand gap in the future.
Sustaining Supply: Gold for the Future
Jurisdictions play an important role when looking for projects that could sustain gold production well into the future.
From political stability to trustworthy legal systems, the characteristics of a jurisdiction can make or break mining projects. Amid ongoing market uncertainty, political turmoil, and resource nationalism, projects in safe jurisdictions offer a better investment opportunity for investors and mining companies.
Today, 10 of the top 15 mining jurisdictions for investment are located in North America, according to the Fraser Institute report published in 2023.
A Golden Opportunity
Located in Alaska, one of the world’s safest mining jurisdictions, NOVAGOLD’s 50% owned Donlin Gold project has the highest average grade of gold among major development projects in the Americas. For every tonne of ore, Donlin Gold offers 2.24 grams of gold, which is more than twice the global average grade of 1.04g/t.
Additionally, Donlin Gold is the second-largest gold-focused development project in the Americas, with over 39 million ounces of gold in M&I resources inclusive of reserves.
NOVAGOLD is focused on the Donlin Gold project in equal partnership with Barrick Gold.
Learn more about Donlin Gold .

-

 Lithium4 days ago
Ranked: The Top 10 EV Battery Manufacturers in 2023
Asia dominates this ranking of the world’s largest EV battery manufacturers in 2023.
-

 Mining1 week ago
Gold vs. S&P 500: Which Has Grown More Over Five Years?
The price of gold has set record highs in 2024, but how has this precious metal performed relative to the S&P 500?
-

 Mining3 weeks ago
Charted: The Value Gap Between the Gold Price and Gold Miners
While the price of gold has reached new record highs in 2024, gold mining stocks are still far from their 2011 peaks.
-

 Uranium2 months ago
Charted: Global Uranium Reserves, by Country
We visualize the distribution of the world’s uranium reserves by country, with 3 countries accounting for more than half of total reserves.
-

 Energy4 months ago
The Periodic Table of Commodity Returns (2014-2023)
Commodity returns in 2023 took a hit. This graphic shows the performance of commodities like gold, oil, nickel, and corn over the last decade.
-

 Mining4 months ago
China Dominates the Supply of U.S. Critical Minerals List
The U.S. Geological Survey estimates that in 2022, China was the world’s leading producer of 30 out of 50 entries on the U.S. critical minerals list.


-
Mining1 week ago
Gold vs. S&P 500: Which Has Grown More Over Five Years?
-

 Markets2 weeks ago
Ranked: The Most Valuable Housing Markets in America
-

 Money2 weeks ago
Which States Have the Highest Minimum Wage in America?
-

 AI2 weeks ago
Ranked: Semiconductor Companies by Industry Revenue Share
-

 Markets2 weeks ago
Ranked: The World’s Top Flight Routes, by Revenue
-

 Countries2 weeks ago
Population Projections: The World’s 6 Largest Countries in 2075
-

 Markets2 weeks ago
The Top 10 States by Real GDP Growth in 2023
-

 Demographics2 weeks ago
The Smallest Gender Wage Gaps in OECD Countries