Mining
Red Lake: The High-Grade Gold Capital of the World
Red Lake: The High-Grade Gold Capital of the World
Sponsored by Gold Canyon Resources (TSX-V: GCU)
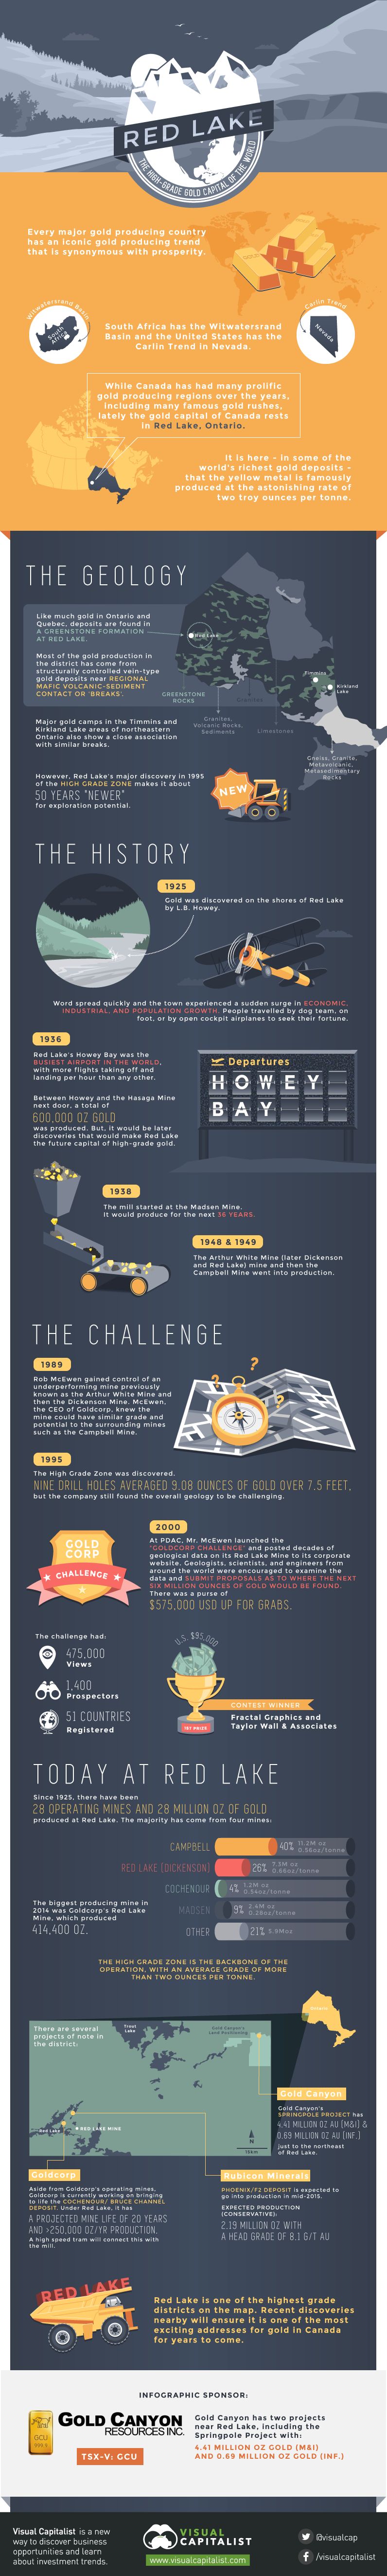
Every major gold producing country has an iconic gold producing trend that is synonymous with prosperity. South Africa has the Witwatersrand Basin and the United States has the Carlin Trend in Nevada.
While Canada has had many prolific gold producing regions over the years, including many famous gold rushes, lately the gold capital of Canada rests in Red Lake, Ontario. It is here – in some of the world’s richest gold deposits – that the yellow metal is famously produced at the astonishing rate of two troy ounces per tonne.
The Geology
Like much gold in Ontario and Quebec, deposits are found in a greenstone formation at Red Lake.
Most of the gold production in the district has come from structurally controlled vein-type gold deposits near regional mafic volcanic-sediment contact or ‘breaks’.
Major gold camps in the Timmins and Kirkland Lake areas of northeastern Ontario also show a close association with similar breaks. However, Red Lake’s major discovery in 1995 of the High Grade Zone makes it about 50 years “newer” for exploration potential.
The History
Gold was discovered on the shores of Red Lake by L.B. Howey in 1925. Word spread quickly and the town experienced a sudden surge in economic, industrial, and population growth. People travelled by dog team, on foot, or by open cockpit airplanes to seek their fortune. By 1936, Red Lake’s Howey Bay was the busiest airport in the world, with more flights taking off and landing per hour than any other.
Between Howey and the Hasaga Mine next door, a total of 600,000 oz gold was produced. But, it would be later discoveries that would make Red Lake the future capital of high-grade gold.
In 1938, the mill started at the Madsen Mine. It would produce for the next 36 years. In 1948 and 1949 respectively, the Arthur White Mine (later Dickenson and Red Lake) mine and then the Campbell Mine went into production.
The Challenge
In the 1989, Rob McEwen gained control of an underperforming mine previously known as the Arthur White Mine and then the Dickenson Mine. McEwen, the CEO of Goldcorp, knew the mine could have similar grade and potential to the surrounding mines such as the Campbell Mine.
In 1995, the High Grade Zone was discovered. Nine drill holes averaged 9.08 ounces of gold over 7.5 feet, but the company still found the overall geology to be challenging.
In 2000 at PDAC, Mr. McEwen launched the “Goldcorp Challenge” and posted decades of geological data on its Red Lake Mine to its corporate website. Geologists, scientists, and engineers from around the world were encouraged to examine the data and submit proposals as to where the next six million ounces of gold would be found. There was a purse of $575,000 USD up for grabs. It was viewed 475,000 times and 1,400 prospectors from 51 countries registered as participants.
Finishing 1st place in the contest:
First Prize – US$95,000 – Fractal Graphics and Taylor Wall & Associates
Today at Red Lake
Since 1925, there have been 28 operating mines and 28 million oz of gold produced at Red Lake. The majority has come from four mines: Red Lake (Dickenson), Campbell, Madsen, and Cochenour.
The biggest producing mine in 2014 was Goldcorp’s Red Lake Mine, which produced 414,400 oz. The High Grade Zone is the backbone of the operation, with an average grade of more than two ounces per tonne.
There are several current projects of note in the district:
- Rubicon Minerals: Rubicon’s Phoenix / F2 Deposit is expected to go into production in mid-2015. It is expected (conservatively) to produce 2.19 million oz with a head grade of 8.1 g/t Au
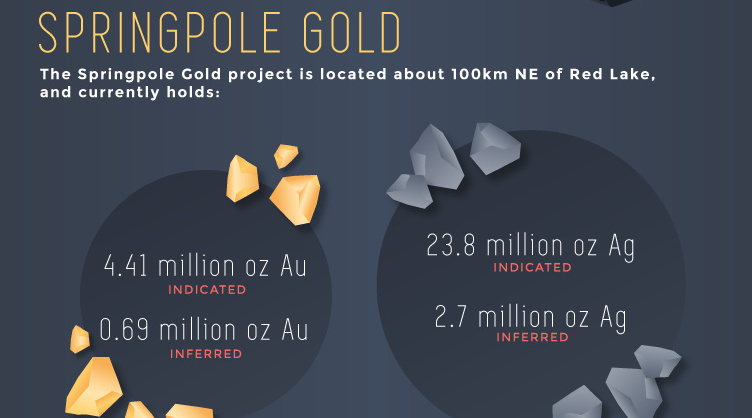
- Gold Canyon: Gold Canyon’s Springpole project has 4.41 million oz gold (M&I) and 0.69 million oz gold (Inf.) just to the northeast of Red Lake
- Goldcorp: Aside from Goldcorp’s operating mines, Goldcorp is currently working on bringing to life the Cochenour / Bruce Channel deposit. Under Red Lake, it has a projected mine life of 20 years and >250,000 oz/yr production. A high speed tram will connect this with the mill.
Lithium
Ranked: The Top 10 EV Battery Manufacturers in 2023
Asia dominates this ranking of the world’s largest EV battery manufacturers in 2023.


The Top 10 EV Battery Manufacturers in 2023
This was originally posted on our Voronoi app. Download the app for free on iOS or Android and discover incredible data-driven charts from a variety of trusted sources.
Despite efforts from the U.S. and EU to secure local domestic supply, all major EV battery manufacturers remain based in Asia.
In this graphic we rank the top 10 EV battery manufacturers by total battery deployment (measured in megawatt-hours) in 2023. The data is from EV Volumes.
Chinese Dominance
Contemporary Amperex Technology Co. Limited (CATL) has swiftly risen in less than a decade to claim the title of the largest global battery group.
The Chinese company now has a 34% share of the market and supplies batteries to a range of made-in-China vehicles, including the Tesla Model Y, SAIC’s MG4/Mulan, and various Li Auto models.
| Company | Country | 2023 Production (megawatt-hour) | Share of Total Production |
|---|---|---|---|
| CATL | 🇨🇳 China | 242,700 | 34% |
| BYD | 🇨🇳 China | 115,917 | 16% |
| LG Energy Solution | 🇰🇷 Korea | 108,487 | 15% |
| Panasonic | 🇯🇵 Japan | 56,560 | 8% |
| SK On | 🇰🇷 Korea | 40,711 | 6% |
| Samsung SDI | 🇰🇷 Korea | 35,703 | 5% |
| CALB | 🇨🇳 China | 23,493 | 3% |
| Farasis Energy | 🇨🇳 China | 16,527 | 2% |
| Envision AESC | 🇨🇳 China | 8,342 | 1% |
| Sunwoda | 🇨🇳 China | 6,979 | 1% |
| Other | - | 56,040 | 8% |
In 2023, BYD surpassed LG Energy Solution to claim second place. This was driven by demand from its own models and growth in third-party deals, including providing batteries for the made-in-Germany Tesla Model Y, Toyota bZ3, Changan UNI-V, Venucia V-Online, as well as several Haval and FAW models.
The top three battery makers (CATL, BYD, LG) collectively account for two-thirds (66%) of total battery deployment.
Once a leader in the EV battery business, Panasonic now holds the fourth position with an 8% market share, down from 9% last year. With its main client, Tesla, now sourcing batteries from multiple suppliers, the Japanese battery maker seems to be losing its competitive edge in the industry.
Overall, the global EV battery market size is projected to grow from $49 billion in 2022 to $98 billion by 2029, according to Fortune Business Insights.

-

 Green1 week ago
Ranking the Top 15 Countries by Carbon Tax Revenue
-

 Technology2 weeks ago
The Stock Performance of U.S. Chipmakers So Far in 2024
-

 Markets2 weeks ago
Charted: Big Four Market Share by S&P 500 Audits
-

 Real Estate2 weeks ago
Ranked: The Most Valuable Housing Markets in America
-

 Money2 weeks ago
Which States Have the Highest Minimum Wage in America?
-

 AI2 weeks ago
Ranked: Semiconductor Companies by Industry Revenue Share
-

 Travel2 weeks ago
Ranked: The World’s Top Flight Routes, by Revenue
-

 Countries2 weeks ago
Population Projections: The World’s 6 Largest Countries in 2075