Mining
Bre-X Scandal: A History Timeline
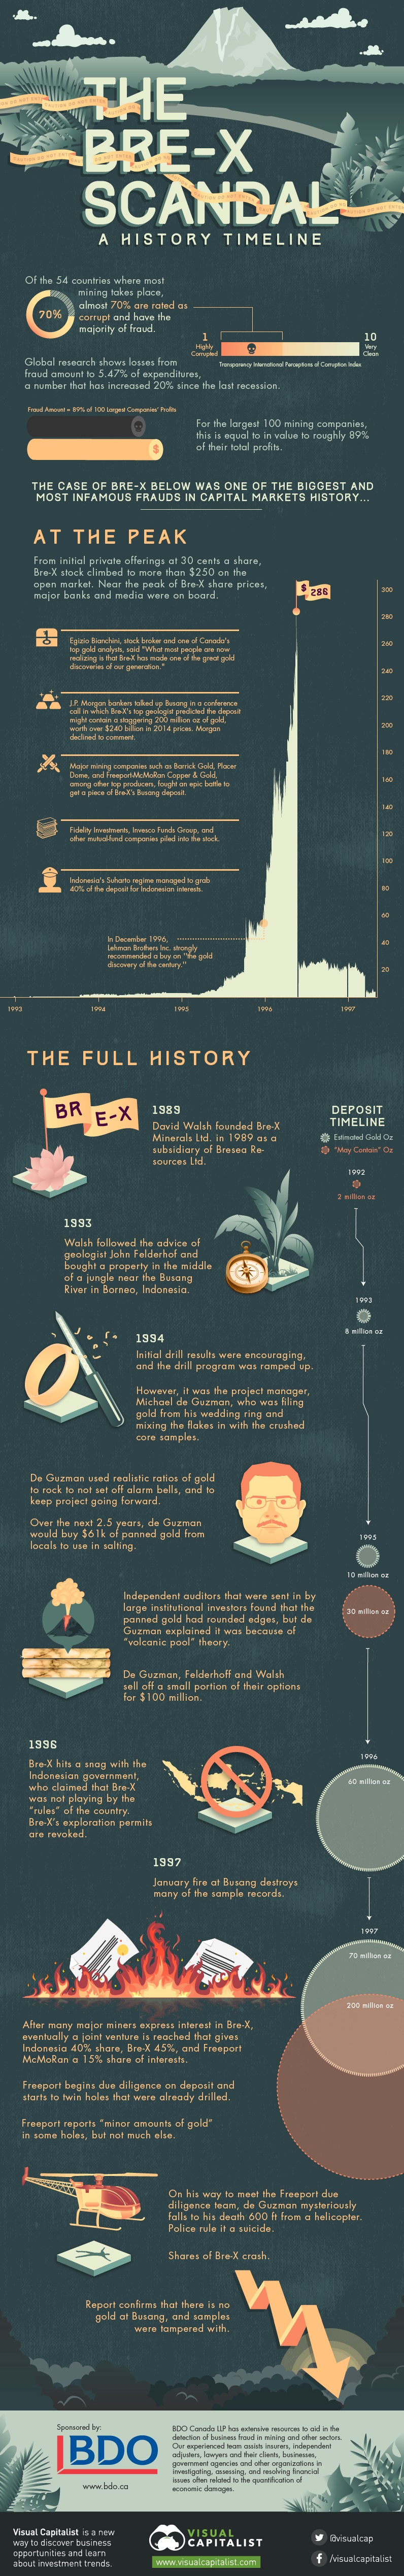
Bre-X Scandal: A History Timeline
Sponsored by: BDO and BDO Natural Resources LinkedIn Group
This infographic documents the rise and fall of Bre-X.
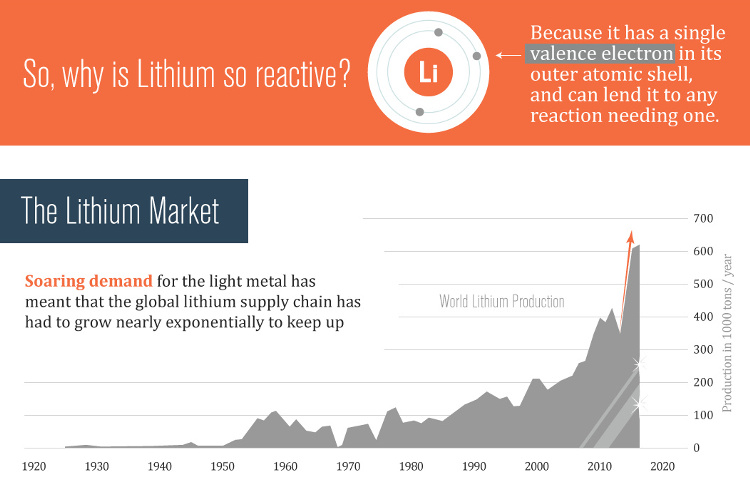
From initial private offerings at 30 cents a share, Bre-X stock climbed to more than $250 on the open market. Near the peak of Bre-X share prices, major banks and media were on board:
The Peak
- It was touted by media and banks as the “richest gold deposit ever”
- In December 1996, Lehman Brothers Inc. strongly recommended a buy on “the gold discovery of the century.”
- Major mining companies such as Barrick Gold, Placer Dome, and Freeport-McMoRan Copper & Gold, among other top producers, fought an epic battle to get a piece of Bre-X’s Busang deposit.
- Indonesia’s Suharto regime managed to grab 40% of the deposit for Indonesian interests.
- Fidelity Investments, Invesco Funds Group, and other mutual-fund companies piled into the stock.
- J.P. Morgan bankers talked up Busang in a conference call in which Bre-X’s top geologist predicted the deposit might contain a staggering 200 million oz of gold, worth over $240 billion in 2014 prices. Morgan declined to comment.
- Egizio Bianchini, stock broker and one of Canada’s top gold analysts, said “What most people are now realizing is that Bre-X has made one of the great gold discoveries of our generation.”
The Timeline:
1989: David Walsh founded Bre-X Minerals Ltd. in 1989 as a subsidiary of Bresea Resources Ltd.
1993: Walsh followed the advice of geologist John Felderhof and bought a property in the middle of a jungle near the Busang River in Borneo, Indonesia.
1994: Initial drill results were encouraging, and the drill program was ramped up.
1994: However, it was the project manager, Michael de Guzman, who was filing gold from his wedding ring and mixing the flakes in with the crushed core samples.
De Guzman used realistic ratios of gold to rock to not set off alarm bells, and to keep project going forward.
Over the next 2.5 years, de Guzman would buy $61k of panned gold from locals to use in salting.
Independent auditors that were sent in by large institutional investors found that the panned gold had rounded edges, but de Guzman explained it was because of “volcanic pool” theory.
De Guzman, Felderhoff and Walsh sell off a small portion of their options for $100 million
1996: Bre-X hits a snag with the Indonesian government, who claimed that Bre-X was not playing by the “rules” of the country. Bre-X’s exploration permits are revoked.
1997: January fire at Busang destroys many of the sample records.
1997: After many major miners express interest in Bre-X, eventually a joint venture is reached that gives Indonesia 40% share, Bre-X 45%, and Freeport McMoRan a 15% share of interests.
1997: Freeport begins due diligence on deposit and starts to twin holes that were already drilled.
1997: Freeport reports “minor amounts of gold” in some holes, but not much else.
1997: On his way to meet the Freeport due diligence team, de Guzman mysteriously falls to his death 600 ft from a helicopter. Police rule it a suicide.
1997: Shares of Bre-X crash.
1997: Report confirms that there is no gold at Busang, and samples were tampered with.


Lithium
Ranked: The Top 10 EV Battery Manufacturers in 2023
Asia dominates this ranking of the world’s largest EV battery manufacturers in 2023.


The Top 10 EV Battery Manufacturers in 2023
This was originally posted on our Voronoi app. Download the app for free on iOS or Android and discover incredible data-driven charts from a variety of trusted sources.
Despite efforts from the U.S. and EU to secure local domestic supply, all major EV battery manufacturers remain based in Asia.
In this graphic we rank the top 10 EV battery manufacturers by total battery deployment (measured in megawatt-hours) in 2023. The data is from EV Volumes.
Chinese Dominance
Contemporary Amperex Technology Co. Limited (CATL) has swiftly risen in less than a decade to claim the title of the largest global battery group.
The Chinese company now has a 34% share of the market and supplies batteries to a range of made-in-China vehicles, including the Tesla Model Y, SAIC’s MG4/Mulan, and various Li Auto models.
| Company | Country | 2023 Production (megawatt-hour) | Share of Total Production |
|---|---|---|---|
| CATL | 🇨🇳 China | 242,700 | 34% |
| BYD | 🇨🇳 China | 115,917 | 16% |
| LG Energy Solution | 🇰🇷 Korea | 108,487 | 15% |
| Panasonic | 🇯🇵 Japan | 56,560 | 8% |
| SK On | 🇰🇷 Korea | 40,711 | 6% |
| Samsung SDI | 🇰🇷 Korea | 35,703 | 5% |
| CALB | 🇨🇳 China | 23,493 | 3% |
| Farasis Energy | 🇨🇳 China | 16,527 | 2% |
| Envision AESC | 🇨🇳 China | 8,342 | 1% |
| Sunwoda | 🇨🇳 China | 6,979 | 1% |
| Other | - | 56,040 | 8% |
In 2023, BYD surpassed LG Energy Solution to claim second place. This was driven by demand from its own models and growth in third-party deals, including providing batteries for the made-in-Germany Tesla Model Y, Toyota bZ3, Changan UNI-V, Venucia V-Online, as well as several Haval and FAW models.
The top three battery makers (CATL, BYD, LG) collectively account for two-thirds (66%) of total battery deployment.
Once a leader in the EV battery business, Panasonic now holds the fourth position with an 8% market share, down from 9% last year. With its main client, Tesla, now sourcing batteries from multiple suppliers, the Japanese battery maker seems to be losing its competitive edge in the industry.
Overall, the global EV battery market size is projected to grow from $49 billion in 2022 to $98 billion by 2029, according to Fortune Business Insights.

-

 Mining1 week ago
Gold vs. S&P 500: Which Has Grown More Over Five Years?
-

 Markets2 weeks ago
Ranked: The Most Valuable Housing Markets in America
-

 Money2 weeks ago
Which States Have the Highest Minimum Wage in America?
-

 AI2 weeks ago
Ranked: Semiconductor Companies by Industry Revenue Share
-

 Markets2 weeks ago
Ranked: The World’s Top Flight Routes, by Revenue
-

 Countries2 weeks ago
Population Projections: The World’s 6 Largest Countries in 2075
-

 Markets2 weeks ago
The Top 10 States by Real GDP Growth in 2023
-

 Demographics2 weeks ago
The Smallest Gender Wage Gaps in OECD Countries