Mining
The Look and Feel of Canadian Venture Market Bottoms (From 1981 to 2014)
The Look and Feel of Canadian Venture Market Bottoms From 1981 to 2014
Special thanks to Dajin Resources for sponsoring. Also, information on market bottoms compiled by Ron Loewen.
In December 2014, the deteriorating market for metals and a suddenly floundering oil price pulled the resource-heavy TSX Venture Index to an all-time low.
Big board indices such as the S&P 500 are still reaching new highs each week, yet this is the second longest bear market since 1932 for gold stocks according to Barron’s Gold Mining Index (BGMI).
While it is difficult to discern if today’s market is truly the absolute bottom, the similarities in media headlines, the tone of discussion, and overall sentiment are reminiscent of bear markets past. That is why, in this infographic, we look at some of the major headlines at market bottoms over the past 35 years including those from the most recent downturn.
When it comes to companies such as those that make up the TSX Venture, it can be incredibly hard to judge fundamentals as there are no earnings or steady revenue growth for most companies. As a result, these markets are driven by greed and fear even more so than other sectors.
It’s important to be a contrarian and to go against the herd mentality. This doesn’t mean going against the grain no matter what, but it means thinking and acting with conviction based on fundamental market truths – regardless of what other people say.
We know that markets, especially those tied to natural resources, tend to be highly cyclical. With the large capital investments and timelines required to advance projects, massive supply challenges must be corrected in subsequent cycles. This can lead to either a rush to buy or sell, and therefore bull and bear markets.
We also know that investor sentiment is largely a psychological phenomenon that can be tied highly with emotions rather than fundamentals. The media can be a big part in echoing or reinforcing this sentiment.
Take a look at the headlines in bear markets bottoms over the last 35 years – do you think we’ve reached a similar place yet in this cycle?


Mining
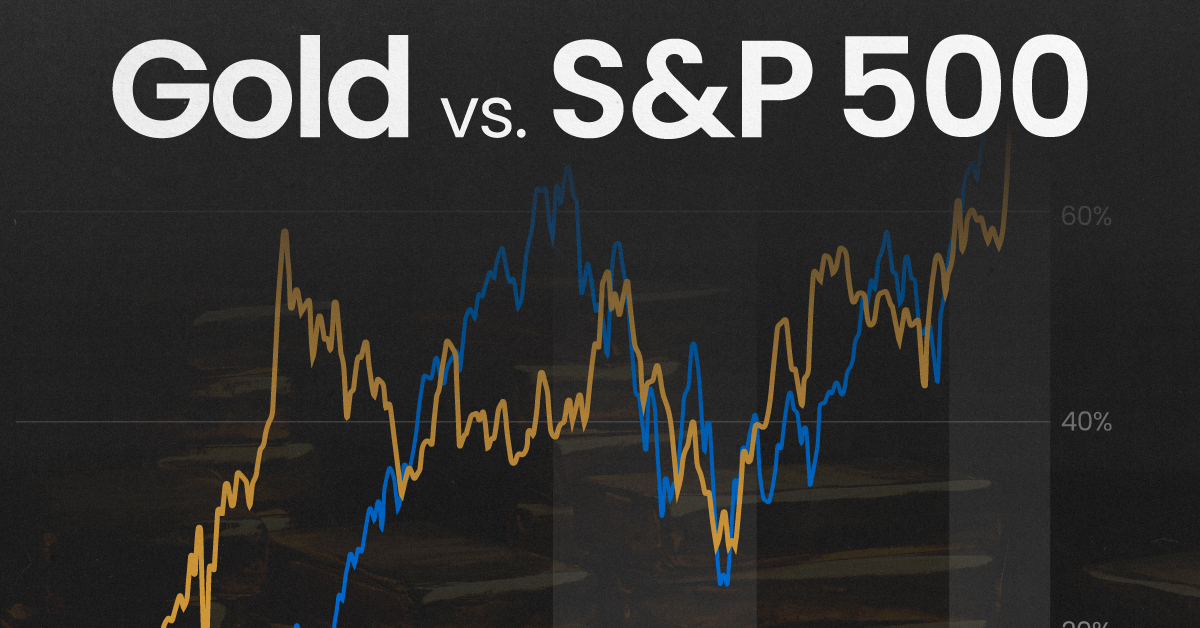
Gold vs. S&P 500: Which Has Grown More Over Five Years?
The price of gold has set record highs in 2024, but how has this precious metal performed relative to the S&P 500?

Gold vs. S&P 500: Which Has Grown More Over Five Years?
This was originally posted on our Voronoi app. Download the app for free on Apple or Android and discover incredible data-driven charts from a variety of trusted sources.
Gold is considered a unique asset due to its enduring value, historical significance, and application in various technologies like computers, spacecraft, and communications equipment.
Commonly regarded as a “safe haven asset”, gold is something investors typically buy to protect themselves during periods of global uncertainty and economic decline.
It is for this reason that gold has performed rather strongly in recent years, and especially in 2024. Persistent inflation combined with multiple wars has driven up demand for gold, helping it set a new all-time high of over $2,400 per ounce.
To put this into perspective, we visualized the performance of gold alongside the S&P 500. See the table below for performance figures as of April 12, 2024.
| Asset/Index | 1 Yr (%) | 5 Yr (%) |
|---|---|---|
| 🏆 Gold | +16.35 | +81.65 |
| 💼 S&P 500 | +25.21 | +76.22 |
Over the five-year period, gold has climbed an impressive 81.65%, outpacing even the S&P 500.
Get Your Gold at Costco
Perhaps a sign of how high the demand for gold is becoming, wholesale giant Costco is reportedly selling up to $200 million worth of gold bars every month in the United States. The year prior, sales only amounted to $100 million per quarter.
Consumers aren’t the only ones buying gold, either. Central banks around the world have been accumulating gold in very large quantities, likely as a hedge against inflation.
According to the World Gold Council, these institutions bought 1,136 metric tons in 2022, marking the highest level since 1950. Figures for 2023 came in at 1,037 metric tons.
See More Graphics on Gold
If you’re fascinated by gold, be sure to check out more Visual Capitalist content including 200 Years of Global Gold Production, by Country or Ranked: The Largest Gold Reserves by Country.

-

 Misc2 weeks ago
Tesla Is Once Again the World’s Best-Selling EV Company
-

 AI1 week ago
The Stock Performance of U.S. Chipmakers So Far in 2024
-

 Misc1 week ago
Almost Every EV Stock is Down After Q1 2024
-

 Money2 weeks ago
Where Does One U.S. Tax Dollar Go?
-

 Green2 weeks ago
Ranked: Top Countries by Total Forest Loss Since 2001
-

 Real Estate2 weeks ago
Visualizing America’s Shortage of Affordable Homes
-

 Maps2 weeks ago
Mapped: Average Wages Across Europe
-

 Mining2 weeks ago
Charted: The Value Gap Between the Gold Price and Gold Miners