United States
Ranked: The Most Prescribed Drugs in the U.S.


Ranked: The Most Prescribed Drugs in the U.S.
Every day, millions of people in the U.S. take prescribed drugs to help them live their lives.
As our understanding of medicine has evolved, we’ve been able to develop drugs to aid with some of the most common medical conditions—from pain and blood pressure drugs to asthma medication, thyroid treatments, and antidepressants.
This graphic uses prescribed medicines data from the U.S. Agency for Healthcare Research and Quality, released in 2021 for the 2019 calendar year. It also uses supporting drug and health information from MedlinePlus.
What are the Most Prescribed Drugs in America?
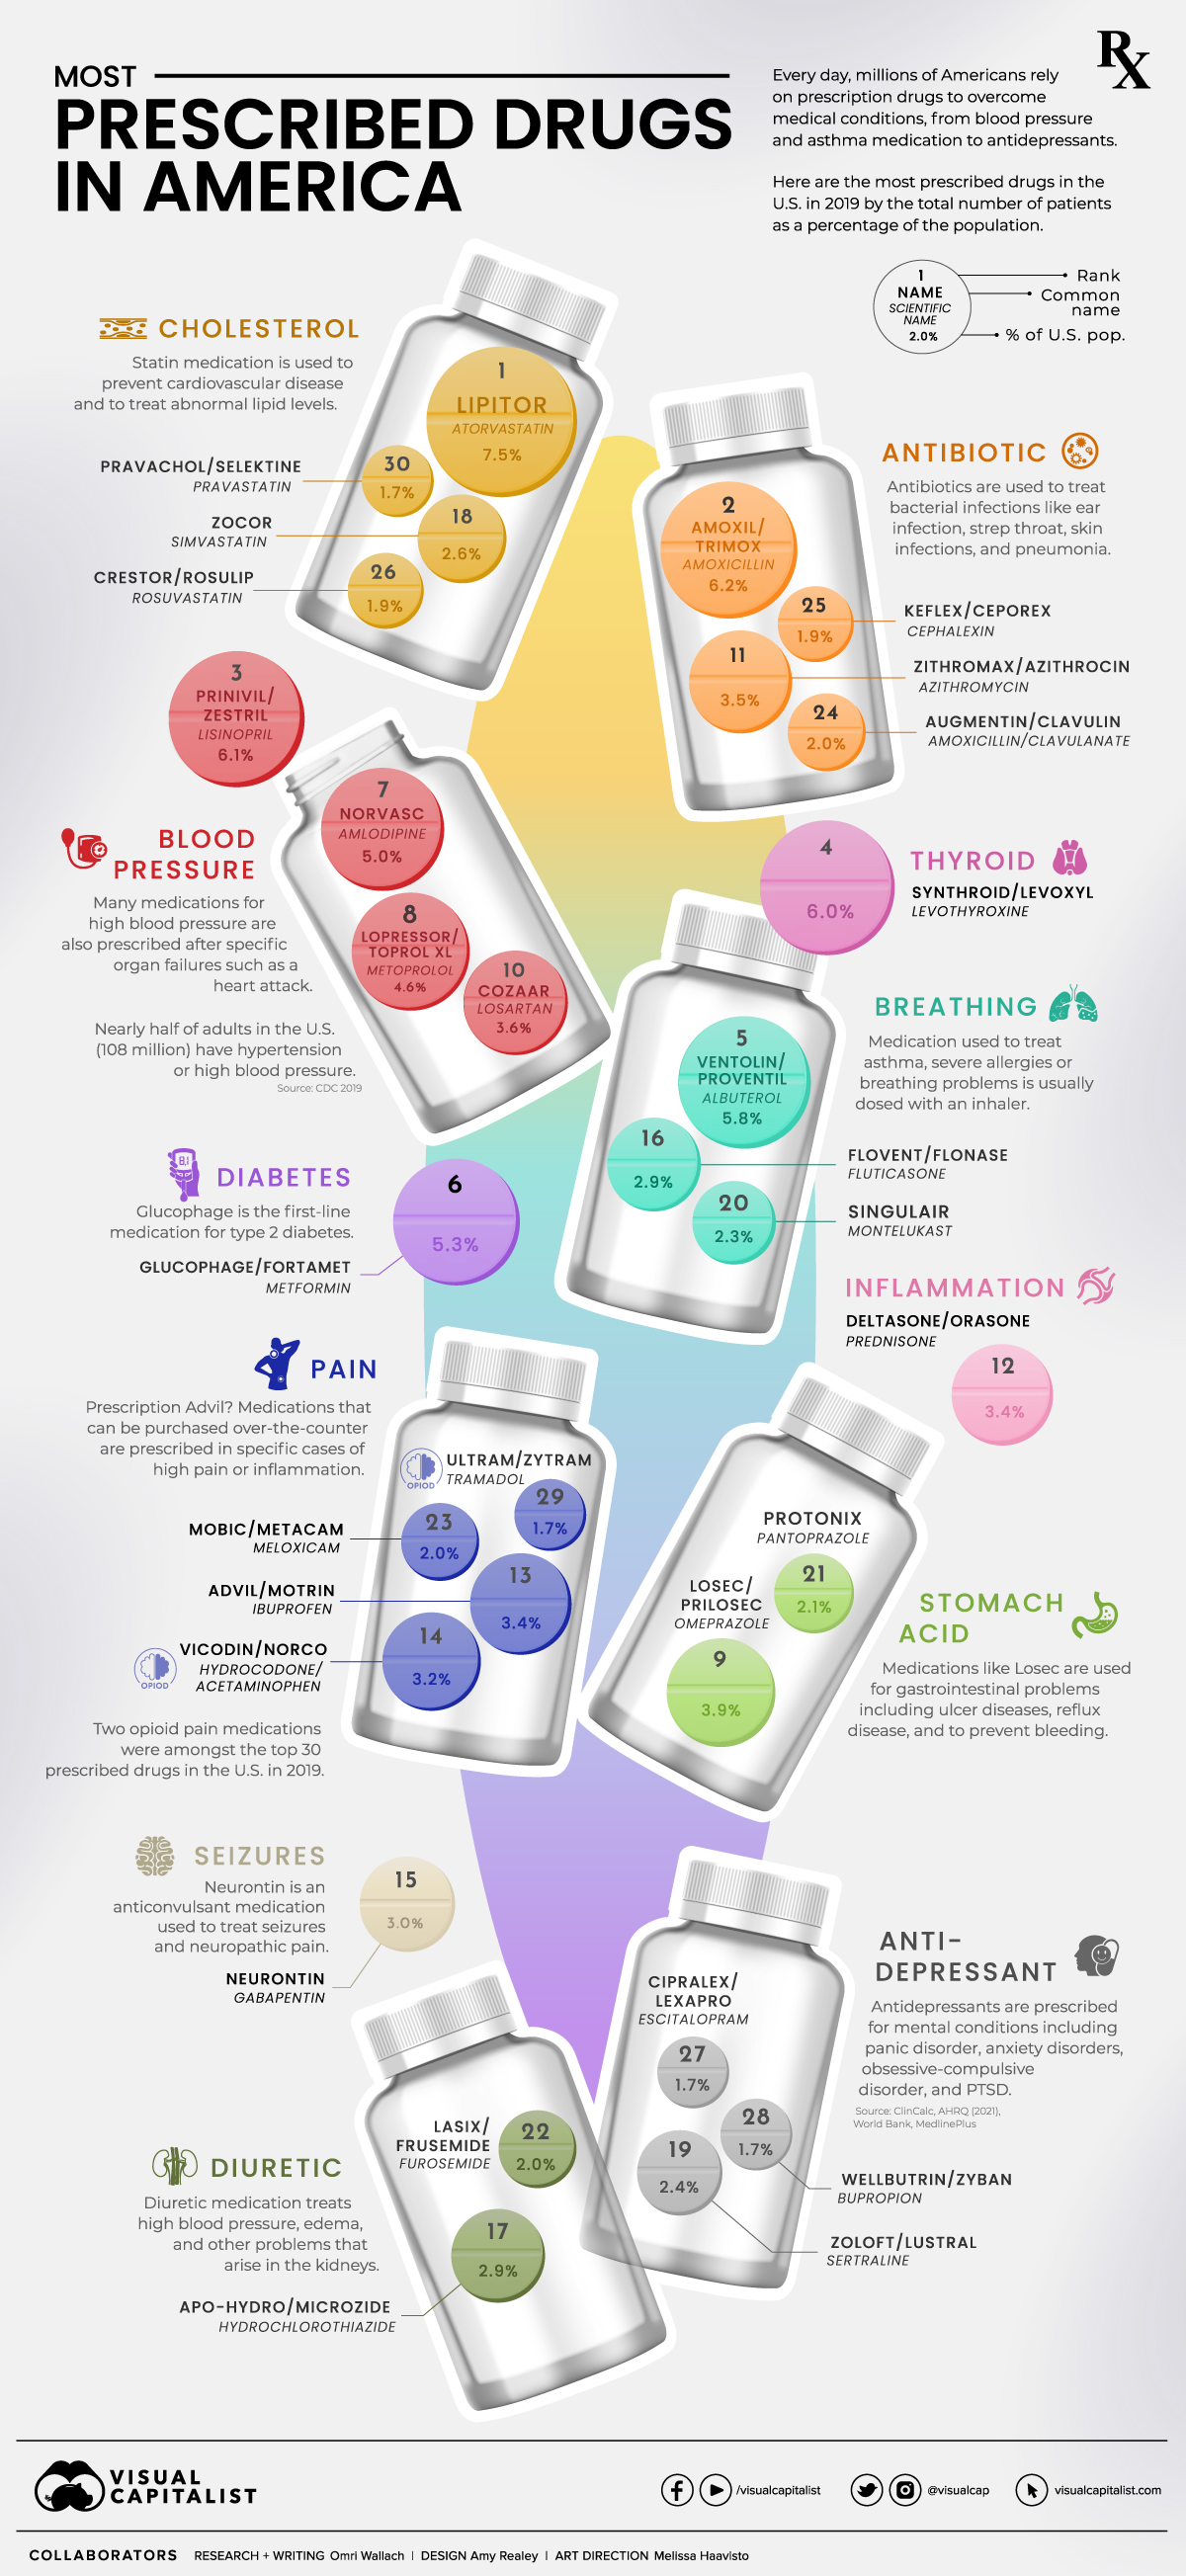
Sorting the annual prescribed medicines data by the total number of patients highlights how important and prevalent some drugs are in America.
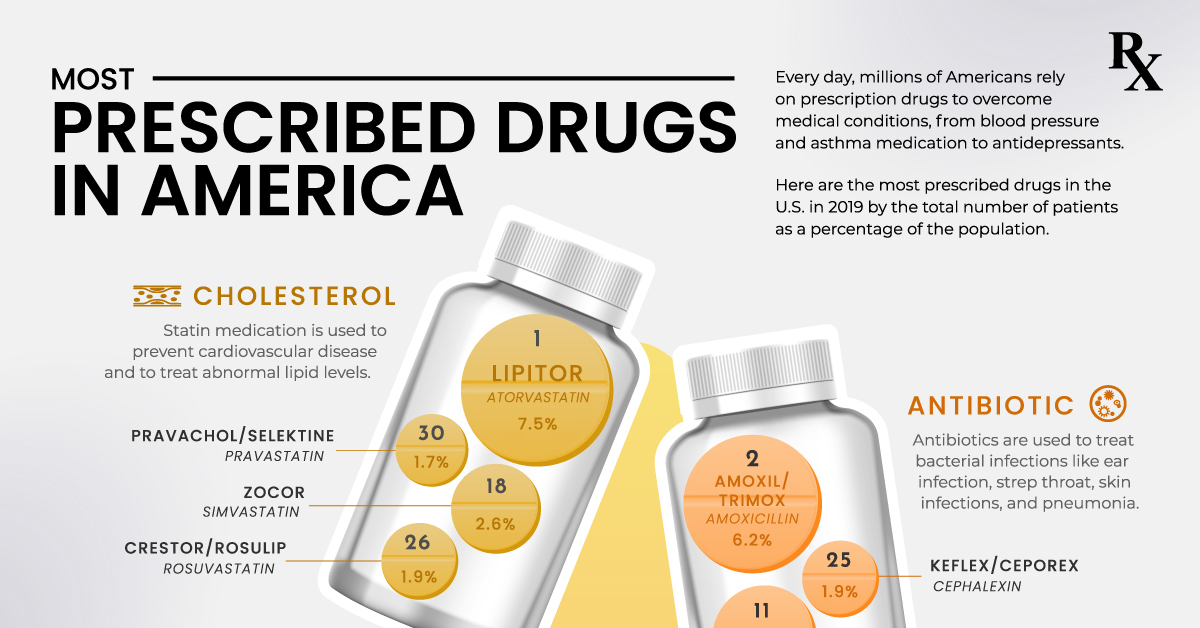
The most prescribed drug, atorvastatin (sold under brand Lipitor), was prescribed to 24.5 million people in the U.S. in 2019, or 7.5% of the population. It was one of many statin medications listed, which are used to prevent cardiovascular disease and treat abnormal lipid levels.
In fact, a majority of the most prescribed drugs in the U.S. are used to treat high blood pressure or symptoms of it. That’s because 108 million or nearly half of adults in the U.S. have hypertension or high blood pressure.
| Drug Name | Total U.S. Patients (2019) | Brand Name | Primary Use |
|---|---|---|---|
| Atorvastatin | 24,493,971 | Lipitor | Cholesterol |
| Amoxicillin | 20,368,921 | Amoxil, Trimox | Antibiotic |
| Lisinopril | 19,990,170 | Prinivil, Zestril | Blood Pressure |
| Levothyroxine | 19,698,087 | Synthroid, Levoxyl | Thyroid |
| Albuterol | 19,085,418 | Ventolin, Proventil | Breathing |
| Metformin | 17,430,765 | Glucophage, Fortamet | Diabetes |
| Amlodipine | 16,419,181 | Norvasc | Blood Pressure |
| Metoprolol | 15,177,787 | Lopressor, Toprol XL | Blood Pressure |
| Omeprazole | 12,869,290 | Losec, Prilosec | Stomach Acid |
| Losartan | 11,760,646 | Cozaar | Blood Pressure |
| Azithromycin | 11,577,286 | Zithromax, Azithrocin | Antibiotic |
| Prednisone | 10,999,246 | Deltasone, Orasone | Inflammation |
| Ibuprofen | 10,951,995 | Advil, Motrin | Pain |
| Hydrocodone/Acetaminophen | 10,409,764 | Vicodin/Norco | Pain (Opioid) |
| Gabapentin | 9,818,634 | Neurontin | Seizures |
| Fluticasone | 9,564,147 | Flovent, Flonase | Breathing |
| Hydrochlorothiazide | 9,358,879 | Apo-Hydro, Microzide | Diuretic |
| Simvastatin | 8,543,612 | Zocor | Cholesterol |
| Sertraline | 7,723,122 | Zoloft, Lustral | Antidepressant |
| Montelukast | 7,429,725 | Singulair | Breathing |
| Pantoprazole | 6,777,996 | Protonix | Stomach Acid |
| Furosemide | 6,640,042 | Lasix, Frusemide | Diuretic |
| Meloxicam | 6,484,210 | Mobic, Metacam | Pain |
| Amoxicillin; Clavulanate | 6,468,086 | Augmentin, Clavulin | Antibiotic |
| Cephalexin | 6,267,878 | Keflex, Ceporex | Antibiotic |
| Rosuvastatin | 6,129,254 | Crestor, Rosulip | Cholesterol |
| Escitalopram | 5,544,406 | Cipralex, Lexapro | Antidepressant |
| Bupropion | 5,520,278 | Wellbutrin, Zyban | Antidepressant |
| Tramadol | 5,496,843 | Ultram, Zytram | Pain (Opioid) |
| Pravastatin | 5,420,488 | Pravachol, Selektine | Cholesterol |
Other common prescriptions include antibiotics like amoxicillin and azithromycin, used to treat bacterial infections, as well as levothyroxine, which was used by 19.7 million Americans to treat thyroid hormone deficiency.
Asthma medication albuterol (usually prescribed through an inhaler) rounded out the top five prescribed drugs with the most patients, followed closely by Type 2 diabetes medication glucophage.
The Top Medical Conditions Treated by Prescription Drugs
The prevalence of cardiovascular-related medication becomes clear when combining the total patients for each type of medication.
The total number of patients with prescribed medication for blood pressure or cholesterol combined for 33% of the U.S. population.
Compared to that, medication for pain or inflammation were the most frequent on the top 30 list with five occurrences, but were only prescribed to 13.6% of people. That includes hydrocodone (known by the brand name Vicodin) and tramadol (known by the brand name Ultram), two opioid medications.
| Primary Use of Prescribed Drug | U.S. Patients as % Pop (2019) |
|---|---|
| Blood Pressure | 19.4% |
| Antibiotic | 13.7% |
| Cholesterol | 13.6% |
| Pain/Inflammation | 13.6% |
| Breathing | 11.0% |
| Thyroid | 6.0% |
| Stomach Acid | 6.0% |
| Antidepressant | 5.7% |
| Diabetes | 5.3% |
| Diuretic | 4.9% |
| Seizures | 3.0% |
Most of the top 30 prescribed medications for specific conditions saw patients total less than 6% of the U.S. population. They include thyroid issues, gastrointestinal conditions, and mental conditions treated by antidepressants (including panic disorder, anxiety disorders, and PTSD).
But it’s important to remember that some patients have multiple prescriptions for serious conditions with multiple symptoms, or comorbid conditions—when more than one disease or condition is present at the same time.
Drug Spending in the U.S.
A prescribed drug’s total number of patients doesn’t necessarily reflect how important it is, or how expensive it is for the end user.
Levothyroxine is the fourth-most prescribed drug by total patients, but the second-most prescribed drug by total prescriptions with 102.6 million in 2019 at an average cost of $25.10 per prescription.
More specialized medication like fluticasone had significantly less total prescriptions with 27.9 million, but an average cost of $97.68 per prescription.
Prices are influenced by a drug’s demand, whether or not it’s patented or available in generic form, and a country’s healthcare system. As far as OECD countries go, the U.S. ranks as the most costly almost across the board.
Since the current rankings look at the U.S. pre-COVID, next year’s prescription data will be illuminating as to the state of American health (and healthcare).


Politics
Charted: Trust in Government Institutions by G7 Countries
How much do you trust the government and its various institutions? We look at data for G7 countries for the time period of 2006-2023.


Trust in Government Institutions by G7 Countries
This was originally posted on our Voronoi app. Download the app for free on iOS or Android and discover incredible data-driven charts from a variety of trusted sources.
How much do you trust the government, and its various institutions?
It’s likely that your level of confidence probably depends on a wide range of factors, such as perceived competency, historical context, economic performance, accountability, social cohesion, and transparency.
And for these same reasons, trust levels in government institutions also change all the time, even in the world’s most developed countries: the G7.
Confidence in Government by G7 Countries (2006-2023)
This chart looks at the changes in trust in government institutions between the years 2006 and 2023, based on data from a multi-country Gallup poll.
Specifically, this dataset aggregates confidence in multiple national institutions, including the military, the judicial system, the national government, and the integrity of the electoral system.
| Country | Confidence (2006) | Confidence (2023) | Change (p.p.) |
|---|---|---|---|
| Canada | 57% | 64% | +7 |
| Britain | 63% | 63% | +0 |
| Germany | 55% | 61% | +6 |
| France | 54% | 60% | +6 |
| Japan | 48% | 59% | +11 |
| Italy | 41% | 54% | +13 |
| United States | 63% | 50% | -13 |
What’s interesting here is that in the G7, a group of the world’s most developed economies, there is only one country bucking the general trend: the United States.
Across most G7 countries, confidence in institutions has either improved or stayed the same between 2006 and 2023. The largest percentage point (p.p.) increases occur in Italy and Japan, which saw +13 p.p. and +11 p.p. increases in trust over the time period.
In the U.S., however, confidence in government institutions has fallen by 13 p.p. over the years. What happened?
Key Figures on U.S. Trust in Institutions
In 2006, the U.S. was tied with the UK as having the highest confidence in government institutions, at 63%.
But here’s where the scores stand in 2023, across various institutions:
| 🇺🇸 Institutions | Confidence (2023) |
|---|---|
| Military | 81% |
| Judiciary | 42% |
| National Government | 30% |
| Elections | 44% |
| Overall | 49% |
Based on this data, it’s clear that the U.S. lags behind in three key indicators: confidence in the national government, confidence in the justice system, and confidence in fair elections. It ranked in last place for each indicator in the G7.
One other data point that stands out: despite leading the world in military spending, the U.S. is only the third most confident in its military in the G7. It lags behind France (86%) and the United Kingdom (83%).

-

 Green6 days ago
The Carbon Footprint of Major Travel Methods
-

 Misc2 weeks ago
How Hard Is It to Get Into an Ivy League School?
-

 Debt2 weeks ago
How Debt-to-GDP Ratios Have Changed Since 2000
-

 Sports2 weeks ago
The Highest Earning Athletes in Seven Professional Sports
-

 Science2 weeks ago
Visualizing the Average Lifespans of Mammals
-

 Brands2 weeks ago
How Tech Logos Have Evolved Over Time
-

 Energy1 week ago
Ranked: The Top 10 EV Battery Manufacturers in 2023
-

 Demographics1 week ago
Countries With the Largest Happiness Gains Since 2010