Mining
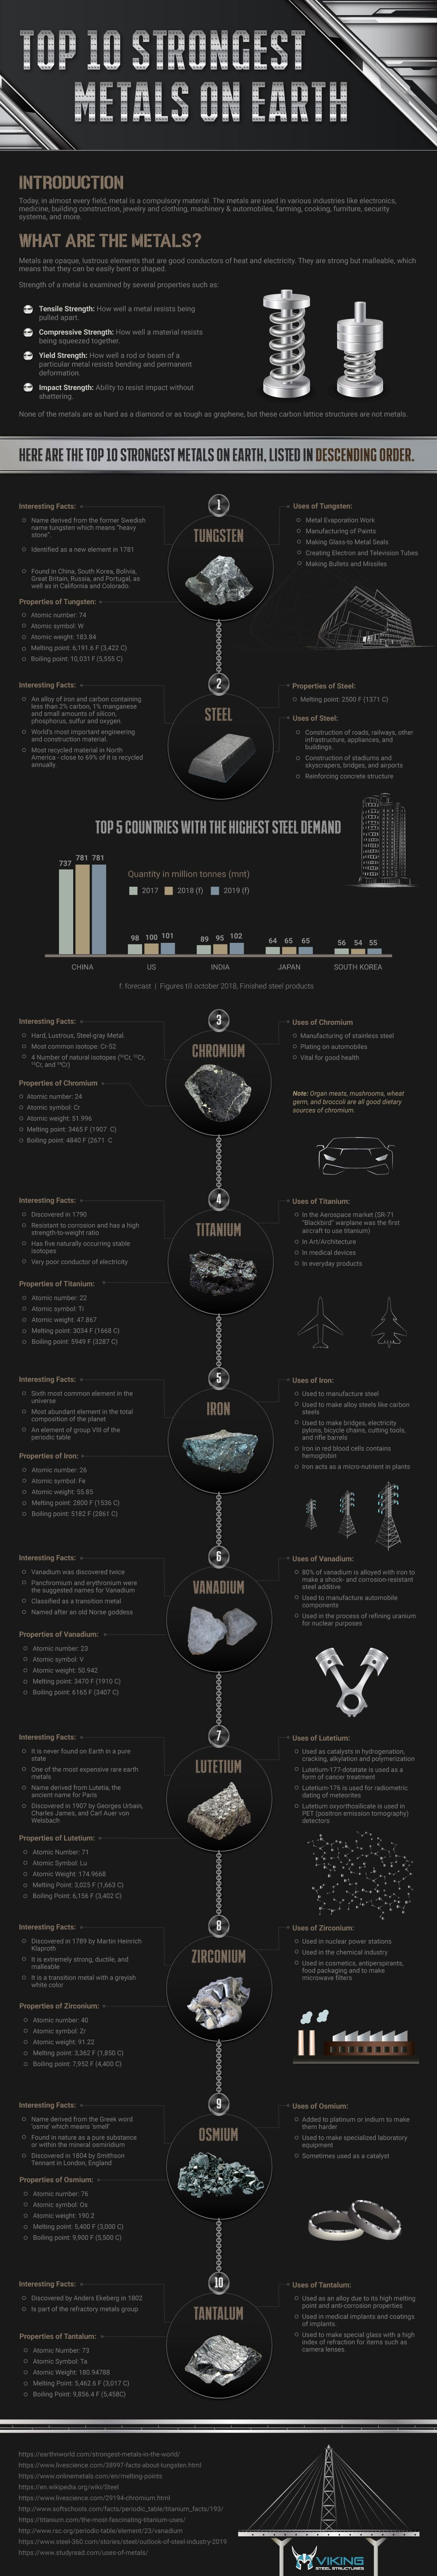
Prove Your Metal: Top 10 Strongest Metals on Earth
The use of metals and the advancement of human civilization have gone hand in hand — and throughout the ages, each metal has proved its worth based on its properties and applications.
Today’s visualization from Viking Steel Structures outlines the 10 strongest metals on Earth and their applications.
What are Metals?
Metals are solid materials that are typically hard, shiny, malleable, and ductile, with good electrical and thermal conductivity. But not all metal is equal, which makes their uses as varied as their individual properties and benefits.
The periodic table below presents a simple view of the relationship between metals, nonmetals, and metalloids, which you can easily identify by color.
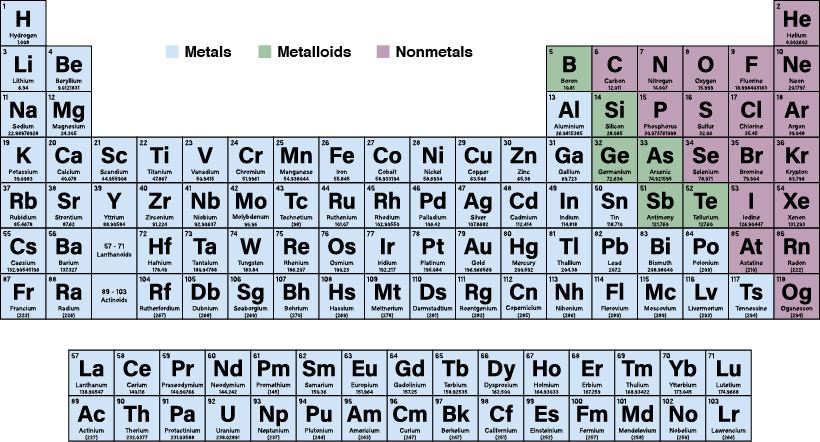
While 91 of the 118 elements of the periodic table are considered to be metals, only a few of them stand out as the strongest.
What Makes a Metal Strong?
The strength of a metal depends on four properties:
- Tensile Strength: How well a metal resists being pulled apart
- Compressive Strength: How well a material resists being squashed together
- Yield Strength: How well a rod or beam of a particular metal resists bending and permanent damage
- Impact Strength: The ability to resist shattering upon impact with another object or surface
Here are the top 10 metals based on these properties.
The Top 10 Strongest Metals
Rank | Type of Metal | Example Use | Atomic Weight | Melting Point |
---|---|---|---|---|
#1 | Tungsten | Making bullets and missiles | 183.84 u | 3422°C / 6192 °F |
#2 | Steel | Construction of railroads, roads, other infrastructure and appliances | n/a | 1371°C / 2500°F |
#3 | Chromium | Manufacturing stainless steel | 51.96 u | 1907°C / 3465°F, |
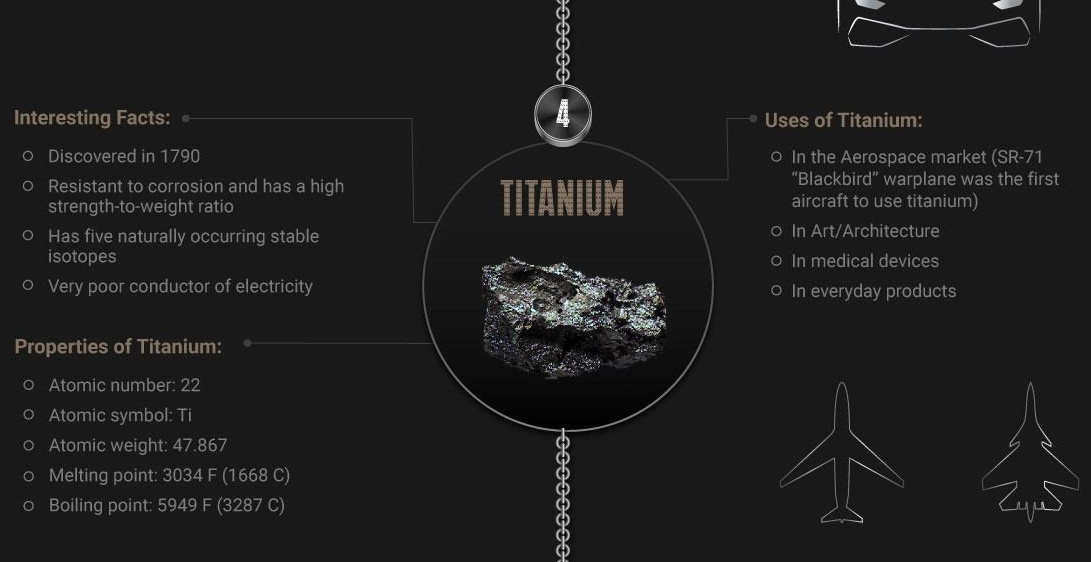
#4 | Titanium | In the aerospace Industry, as a lightweight material with strength | 47.87 u | 1668°C / 3032°F |
#5 | Iron | Used to make bridges, electricity, pylons, bicycle chains, cutting tools and rifle barrels | 55.85 u | 1536°C / 2800°F |
#6 | Vanadium | 80% of vanadium is alloyed with iron to make steel shock and corrosion resistance | 50.942 u | 1910°C / 3470°F |
#7 | Lutetium | Used as catalysts in petroleum production. | 174.96 u | 1663 °C / 3025°F |
#8 | Zirconium | Used in nuclear power stations. | 91.22 u | 1850°C / 3.362°F |
#9 | Osmium | Added to platinum or indium to make them harder. | 190.2 u | 3000°C / 5,400°F |
#10 | Tantalum | Used as an alloy due to its high melting point and anti-corrosion. | 180.94 u | 3,017°C / 5462°F |
Out of the Forge and into Tech: Metals for the Future
While these metals help to forge the modern world, there is a new class of metals that are set to create a new future.
Rare Earth elements (REEs) are a group of metals do not rely on their strength, but instead their importance in applications in new technologies, including those used for green energy.
Metal | Uses |
---|---|
Neodymium | Magnets containing neodymium are used in green technologies such as the manufacture of wind turbines and hybrid cars. |
Lanthanum | Used in catalytic converters in cars, enabling them to run at high temperatures |
Cerium | This element is used in camera and telescope lenses. |
Praseodymium | Used to create strong metals for use in aircraft engines. |
Gadolinium | Used in X-ray and MRI scanning systems, and also in television screens. |
Yttrium, terbium, europium | Making televisions and computer screens and other devices that have visual displays. |
If the world is going to move towards a more sustainable and efficient future, metals—both tough and smart—are going to be critical. Each one will serve a particular purpose to build the infrastructure and technology for the next generation.
Our ability to deploy technology with the right materials will test the world’s mettle to meet the challenges of tomorrow—so choose wisely.
Mining
Mapped: The 10 Largest Gold Mines in the World, by Production
Gold mining companies produced over 3,500 tonnes of gold in 2021. Where in the world are the largest gold mines?

The 10 Largest Gold Mines in the World, by Production
This was originally posted on Elements. Sign up to the free mailing list to get beautiful visualizations on natural resource megatrends in your email every week.
Gold mining is a global business, with hundreds of mining companies digging for the precious metal in dozens of countries.
But where exactly are the largest gold mines in the world?
The above infographic uses data compiled from S&P Global Market Intelligence and company reports to map the top 10 gold-producing mines in 2021.
Editor’s Note: The article uses publicly available global production data from the World Gold Council to calculate the production share of each mine. The percentages slightly differ from those calculated by S&P.
The Top Gold Mines in 2021
The 10 largest gold mines are located across nine different countries in North America, Oceania, Africa, and Asia.
Together, they accounted for around 13 million ounces or 12% of global gold production in 2021.
Rank | Mine | Location | Production (ounces) | % of global production |
---|---|---|---|---|
#1 | Nevada Gold Mines | 🇺🇸 U.S. | 3,311,000 | 2.9% |
#2 | Muruntau | 🇺🇿 Uzbekistan | 2,990,020 | 2.6% |
#3 | Grasberg | 🇮🇩 Indonesia | 1,370,000 | 1.2% |
#4 | Olimpiada | 🇷🇺 Russia | 1,184,068 | 1.0% |
#5 | Pueblo Viejo | 🇩🇴 Dominican Republic | 814,000 | 0.7% |
#6 | Kibali | 🇨🇩 Democratic Republic of the Congo | 812,000 | 0.7% |
#7 | Cadia | 🇦🇺 Australia | 764,895 | 0.7% |
#8 | Lihir | 🇵🇬 Papua New Guinea | 737,082 | 0.6% |
#9 | Canadian Malartic | 🇨🇦 Canada | 714,784 | 0.6% |
#10 | Boddington | 🇦🇺 Australia | 696,000 | 0.6% |
N/A | Total | N/A | 13,393,849 | 11.7% |
Share of global gold production is based on 3,561 tonnes (114.5 million troy ounces) of 2021 production as per the World Gold Council.
In 2019, the world’s two largest gold miners—Barrick Gold and Newmont Corporation—announced a historic joint venture combining their operations in Nevada. The resulting joint corporation, Nevada Gold Mines, is now the world’s largest gold mining complex with six mines churning out over 3.3 million ounces annually.
Uzbekistan’s state-owned Muruntau mine, one of the world’s deepest open-pit operations, produced just under 3 million ounces, making it the second-largest gold mine. Muruntau represents over 80% of Uzbekistan’s overall gold production.
Only two other mines—Grasberg and Olimpiada—produced more than 1 million ounces of gold in 2021. Grasberg is not only the third-largest gold mine but also one of the largest copper mines in the world. Olimpiada, owned by Russian gold mining giant Polyus, holds around 26 million ounces of gold reserves.
Polyus was also recently crowned the biggest miner in terms of gold reserves globally, holding over 104 million ounces of proven and probable gold between all deposits.
How Profitable is Gold Mining?
The price of gold is up by around 50% since 2016, and it’s hovering near the all-time high of $2,000/oz.
That’s good news for gold miners, who achieved record-high profit margins in 2020. For every ounce of gold produced in 2020, gold miners pocketed $828 on average, significantly higher than the previous high of $666/oz set in 2011.
With inflation rates hitting decade-highs in several countries, gold mining could be a sector to watch, especially given gold’s status as a traditional inflation hedge.
Mining
The 50 Minerals Critical to U.S. Security
This graphic lists all minerals that are deemed critical to both the economic and national security of the United States.

The 50 Minerals Critical to U.S. Security
This was originally posted on Elements. Sign up to the free mailing list to get beautiful visualizations on natural resource megatrends in your email every week.
The U.S. aims to cut its greenhouse gas emissions in half by 2030 as part of its commitment to tackling climate change, but might be lacking the critical minerals needed to achieve its goals.
The American green economy will rely on renewable sources of energy like wind and solar, along with the electrification of transportation. However, local production of the raw materials necessary to produce these technologies, including solar panels, wind turbines, and electric vehicles, is lacking. Understandably, this has raised concerns in Washington.
In this graphic, based on data from the U.S. Geological Survey, we list all of the minerals that the government has deemed critical to both the economic and national security of the United States.
What are Critical Minerals?
A critical mineral is defined as a non-fuel material considered vital for the economic well-being of the world’s major and emerging economies, whose supply may be at risk. This can be due to geological scarcity, geopolitical issues, trade policy, or other factors.
In 2018, the U.S. Department of the Interior released a list of 35 critical minerals. The new list, released in February 2022, contains 15 more commodities.
Much of the increase in the new list is the result of splitting the rare earth elements and platinum group elements into individual entries rather than including them as “mineral groups.” In addition, the 2022 list of critical minerals adds nickel and zinc to the list while removing helium, potash, rhenium, and strontium.
Mineral | Example Uses | Net Import Reliance |
---|---|---|
Beryllium | Alloying agent in aerospace, defense industries | 11% |
Aluminum | Power lines, construction, electronics | 13% |
Zirconium | High-temparature ceramics production | 25% |
Palladium | Catalytic converters | 40% |
Germanium | Fiber optics, night vision applications | 50% |
Lithium | Rechargeable batteries | 50% |
Magnesium | Alloys, electronics | 50% |
Nickel | Stainless steel, rechargeable batteries | 50% |
Tungsten | Wear-resistant metals | 50% |
Barite | Hydrocarbon production | 75% |
Chromium | Stainless steel | 75% |
Tin | Coatings, alloys for steel | 75% |
Cobalt | Rechargeable batteries, superalloys | 76% |
Platinum | Catalytic converters | 79% |
Antimony | Lead-acid batteries, flame retardants | 81% |
Zinc | Metallurgy to produce galvanized steel | 83% |
Titanium | White pigment, metal alloys | 88% |
Bismuth | Medical, atomic research | 94% |
Tellurium | Solar cells, thermoelectric devices | 95% |
Vanadium | Alloying agent for iron and steel | 96% |
Arsenic | Semi-conductors, lumber preservatives, pesticides | 100% |
Cerium | Catalytic converters, ceramics, glass, metallurgy | 100% |
Cesium | Research, development | 100% |
Dysprosium | Data storage devices, lasers | 100% |
Erbium | Fiber optics, optical amplifiers, lasers | 100% |
Europium | Phosphors, nuclear control rods | 100% |
Fluorspar | Manufacture of aluminum, cement, steel, gasoline | 100% |
Gadolinium | Medical imaging, steelmaking | 100% |
Gallium | Integrated circuits, LEDs | 100% |
Graphite | Lubricants, batteries | 100% |
Holmium | Permanent magnets, nuclear control rods | 100% |
Indium | Liquid crystal display screens | 100% |
Lanthanum | Catalysts, ceramics, glass, polishing compounds | 100% |
Lutetium | Scintillators for medical imaging, cancer therapies | 100% |
Manganese | Steelmaking, batteries | 100% |
Neodymium | Rubber catalysts, medical, industrial lasers | 100% |
Niobium | Steel, superalloys | 100% |
Praseodymium | Permanent magnets, batteries, aerospace alloys | 100% |
Rubidium | Research, development in electronics | 100% |
Samarium | Cancer treatment, absorber in nuclear reactors | 100% |
Scandium | Alloys, ceramics, fuel cells | 100% |
Tantalum | Electronic components, superalloys | 100% |
Terbium | Permanent magnets, fiber optics, lasers | 100% |
Thulium | Metal alloys, lasers | 100% |
Ytterbium | Catalysts, scintillometers, lasers, metallurgy | 100% |
Yttrium | Ceramic, catalysts, lasers, metallurgy, phosphors | 100% |
Iridium | Coating of anodes for electrochemical processes | No data available |
Rhodium | Catalytic converters, electrical components | No data available |
Ruthenium | Electrical contacts, chip resistors in computers | No data available |
Hafnium | Nuclear control rods, alloys | Net exporter |
The challenge for the U.S. is that the local production of these raw materials is extremely limited.
For instance, in 2021 there was only one operating nickel mine in the country, the Eagle mine in Michigan. The facility ships its concentrates abroad for refining and is scheduled to close in 2025. Likewise, the country only hosted one lithium mine, the Silver Peak Mine in Nevada.
At the same time, most of the country’s supply of critical minerals depends on countries that have historically competed with America.
China’s Dominance in Minerals
Perhaps unsurprisingly, China is the single largest supply source of mineral commodities for the United States.
Cesium, a critical metal used in a wide range of manufacturing, is one example. There are only three pegmatite mines in the world that can produce cesium, and all were controlled by Chinese companies in 2021.
Furthermore, China refines nearly 90% of the world’s rare earths. Despite the name, these elements are abundant on the Earth’s crust and make up the majority of listed critical minerals. They are essential for a variety of products like EVs, advanced ceramics, computers, smartphones, wind turbines, monitors, and fiber optics.
After China, the next largest source of mineral commodities to the United States has been Canada, which provided the United States with 16 different elements in 2021.
The Rising Demand for Critical Minerals
As the world’s clean energy transitions gather pace, demand for critical minerals is expected to grow quickly.
According to the International Energy Association, the rise of low-carbon power generation is projected to triple mineral demand from this sector by 2040.
The shift to a sustainable economy is important, and consequently, securing the critical minerals necessary for it is just as vital.
-
Misc2 weeks ago
The Top 10 Largest Nuclear Explosions, Visualized
-
Energy2 weeks ago
Mapped: Solar and Wind Power by Country
-
Politics2 weeks ago
Mapped: The State of Global Democracy in 2022
-
Datastream4 weeks ago
Visualizing Companies with the Most Patents Granted in 2021
-
Technology2 weeks ago
Synthetic Biology: The $3.6 Trillion Science Changing Life as We Know It
-
Markets4 weeks ago
Why Investors Tuned Out Netflix
-
Energy1 week ago
Visualizing U.S. Crude Oil and Petroleum Product Imports in 2021
-
Markets3 weeks ago
Charted: U.S. Consumer Debt Approaches $16 Trillion