Mining
The New Energy Era: The Lithium-Ion Supply Chain
The world is rapidly shifting to renewable energy technologies.
Battery minerals are set to become the new oil, with lithium-ion battery supply chains becoming the new pipelines.
China is currently leading this lithium-ion battery revolution—leaving the U.S. dependent on its economic rival. However, the harsh lessons of the 1970-80s oil crises have increased pressure on the U.S. to develop its own domestic energy supply chain and gain access to key battery metals.
Introducing the New Energy Era
Today’s infographic from Standard Lithium explores the current energy landscape and America’s position in the new energy era.

An Energy Dependence Problem
Energy dependence is the degree of a nation’s reliance on imported energy, resulting from an insufficient domestic supply. Oil crises in the 1970-80s revealed America’s reliance on foreign produced oil, especially from the Middle East.
The U.S. economy ground to a halt when gas prices soared during the 1973 oil crisis—altering consumer behavior and energy policy for generations. In the aftermath of the crisis, the government imposed national speed limits to conserve oil, and also demanded cheaper, smaller, and more fuel-efficient cars.
U.S. administrations set an objective to wean America off foreign oil through “energy independence”—the ability to meet the country’s fuel needs using domestic resources.
Lessons Learned?
Spurred by technological breakthroughs such as hydraulic fracking, the U.S. now has the capacity to respond to high oil prices by ramping up domestic production.
By the end of 2019, total U.S. oil production could rise to 17.4 million barrels a day. At that level, American net imports of petroleum could fall in December 2019 to 320,000 barrels a day, the lowest since 1949.
In fact, the successful development of America’s shale fields is a key reason why the Organization of the Petroleum Exporting Countries (OPEC) has lost the majority of its influence over the supply and price of oil.
A Renewable Future: Turning the Ship
The increasing scarcity of economic oil and gas fields, combined with the negative environmental impacts of oil and the declining costs of renewable power, are creating a new energy supply and demand dynamic.
Oil demand could drop by 16.5 million barrels per day. Oil producers could face significant losses, with $380 billion of above-ground investments becoming worthless if the oil industry and oil-rich nations are not prepared for a surge in green energy by 2030.
Energy companies are hedging their risk with increased investment in renewables. The world’s top 24 publicly-listed oil companies spent on average 1.3% of their total budgets on low carbon technology in 2018, amounting to $260 billion. That is double the 0.68% the same group had invested on average through the period of 2010 and 2017.
The New Geopolitics of Energy: Battery Minerals
Low carbon technologies for the new energy era are also creating a demand for specific materials and new supply chains that can procure them.
Renewable and low carbon technology will be mineral intensive, requiring many metals such as lithium, cobalt, graphite and nickel. These are key raw materials, and demand will only grow.
| Material | 2018 | 2028 | 2018-2028 % Growth |
|---|---|---|---|
| Graphite anode in Batteries | 170,000 tonnes | 2.05M tonnes | 1,106% |
| Lithium in batteries | 150,000 tonnes | 1.89M tonnes | 1,160% |
| Nickel in batteries | 82,000 tonnes | 1.09M tonnes | 1,229% |
| Cobalt in batteries | 58,000 tonnes | 320,000 tonnes | 452% |
The cost of these materials is the largest factor in battery technology, and will determine whether battery supply chains succeed or fail.
China currently dominates the lithium-ion battery supply chain, and could continue to do so. This leaves the U.S. dependent on China as we venture into this new era.
Could history repeat itself?
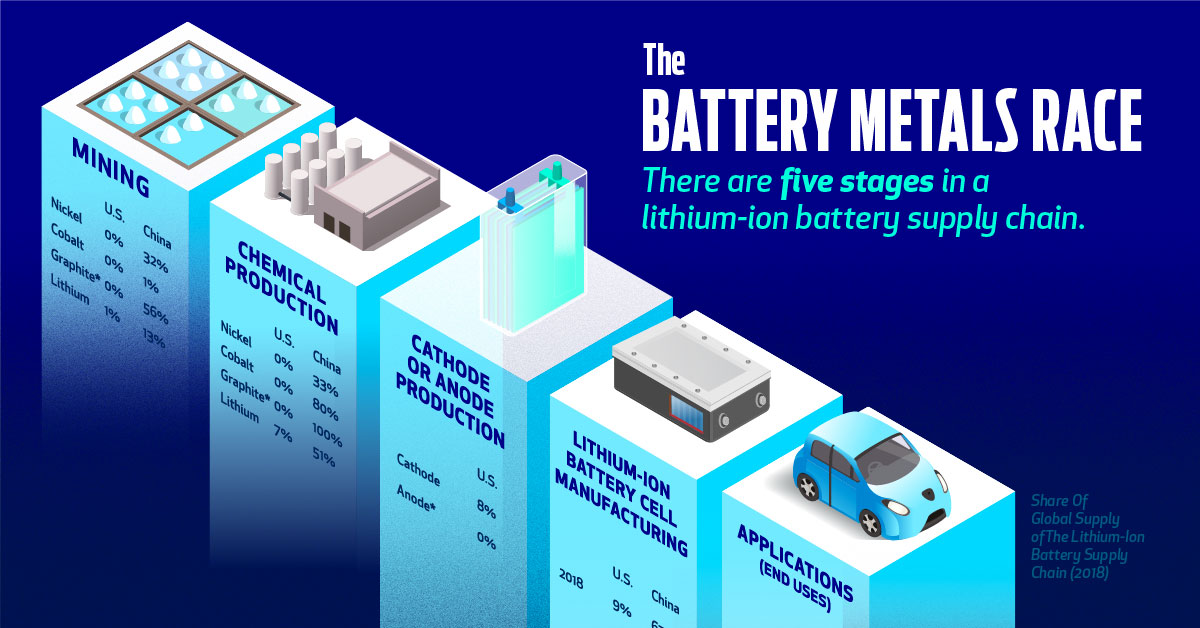
The Battery Metals Race
There are five stages in a lithium-ion battery supply chain—and the U.S. holds a smaller percentage of the global supply chain than China at nearly every stage.
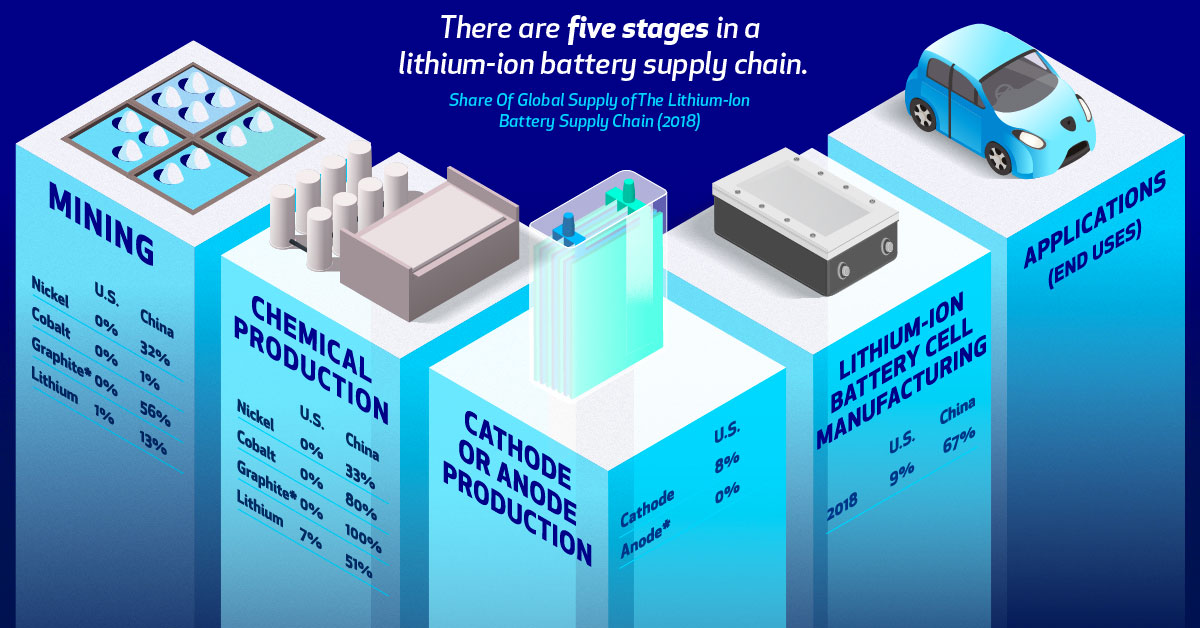
China’s dominance of the global battery supply chain creates a competitive advantage that the U.S. has no choice but to rely on.
However, this can still be prevented if the United States moves fast. From natural resources, human capital and the technology, the U.S. can build its own domestic supply.
Building the U.S. Battery Supply Chain
The U.S. relies heavily on imports of several keys materials necessary for a lithium-ion battery supply chain.
| U.S. Net Import Dependence | |
|---|---|
| Lithum | 50% |
| Cobalt | 72% |
| Graphite | 100% |
But the U.S. is making strides to secure its place in the new energy era. The American Minerals Security Act seeks to identify the resources necessary to secure America’s mineral independence.
The government has also released a list of 35 minerals it deems critical to the national interest.
Declaring U.S. Battery Independence
A supply chain starts with raw materials, and the U.S. has the resources necessary to build its own battery supply chain. This would help the country avoid supply disruptions like those seen during the oil crises in the 1970s.
Battery metals are becoming the new oil and supply chains the new pipelines. It is still early in this new energy era, and the victors are yet to be determined in the battery arms race.


Lithium
Ranked: The Top 10 EV Battery Manufacturers in 2023
Asia dominates this ranking of the world’s largest EV battery manufacturers in 2023.


The Top 10 EV Battery Manufacturers in 2023
This was originally posted on our Voronoi app. Download the app for free on iOS or Android and discover incredible data-driven charts from a variety of trusted sources.
Despite efforts from the U.S. and EU to secure local domestic supply, all major EV battery manufacturers remain based in Asia.
In this graphic we rank the top 10 EV battery manufacturers by total battery deployment (measured in megawatt-hours) in 2023. The data is from EV Volumes.
Chinese Dominance
Contemporary Amperex Technology Co. Limited (CATL) has swiftly risen in less than a decade to claim the title of the largest global battery group.
The Chinese company now has a 34% share of the market and supplies batteries to a range of made-in-China vehicles, including the Tesla Model Y, SAIC’s MG4/Mulan, and various Li Auto models.
| Company | Country | 2023 Production (megawatt-hour) | Share of Total Production |
|---|---|---|---|
| CATL | 🇨🇳 China | 242,700 | 34% |
| BYD | 🇨🇳 China | 115,917 | 16% |
| LG Energy Solution | 🇰🇷 Korea | 108,487 | 15% |
| Panasonic | 🇯🇵 Japan | 56,560 | 8% |
| SK On | 🇰🇷 Korea | 40,711 | 6% |
| Samsung SDI | 🇰🇷 Korea | 35,703 | 5% |
| CALB | 🇨🇳 China | 23,493 | 3% |
| Farasis Energy | 🇨🇳 China | 16,527 | 2% |
| Envision AESC | 🇨🇳 China | 8,342 | 1% |
| Sunwoda | 🇨🇳 China | 6,979 | 1% |
| Other | - | 56,040 | 8% |
In 2023, BYD surpassed LG Energy Solution to claim second place. This was driven by demand from its own models and growth in third-party deals, including providing batteries for the made-in-Germany Tesla Model Y, Toyota bZ3, Changan UNI-V, Venucia V-Online, as well as several Haval and FAW models.
The top three battery makers (CATL, BYD, LG) collectively account for two-thirds (66%) of total battery deployment.
Once a leader in the EV battery business, Panasonic now holds the fourth position with an 8% market share, down from 9% last year. With its main client, Tesla, now sourcing batteries from multiple suppliers, the Japanese battery maker seems to be losing its competitive edge in the industry.
Overall, the global EV battery market size is projected to grow from $49 billion in 2022 to $98 billion by 2029, according to Fortune Business Insights.

-

 Brands6 days ago
How Tech Logos Have Evolved Over Time
-

 Demographics2 weeks ago
The Smallest Gender Wage Gaps in OECD Countries
-

 Economy2 weeks ago
Where U.S. Inflation Hit the Hardest in March 2024
-

 Green2 weeks ago
Top Countries By Forest Growth Since 2001
-

 United States2 weeks ago
Ranked: The Largest U.S. Corporations by Number of Employees
-

 Maps2 weeks ago
The Largest Earthquakes in the New York Area (1970-2024)
-

 Green2 weeks ago
Ranked: The Countries With the Most Air Pollution in 2023
-

 Green2 weeks ago
Ranking the Top 15 Countries by Carbon Tax Revenue