Markets
Charting the World’s Major Stock Markets on the Same Scale (1990-2019)
Charting the World’s Major Stock Markets
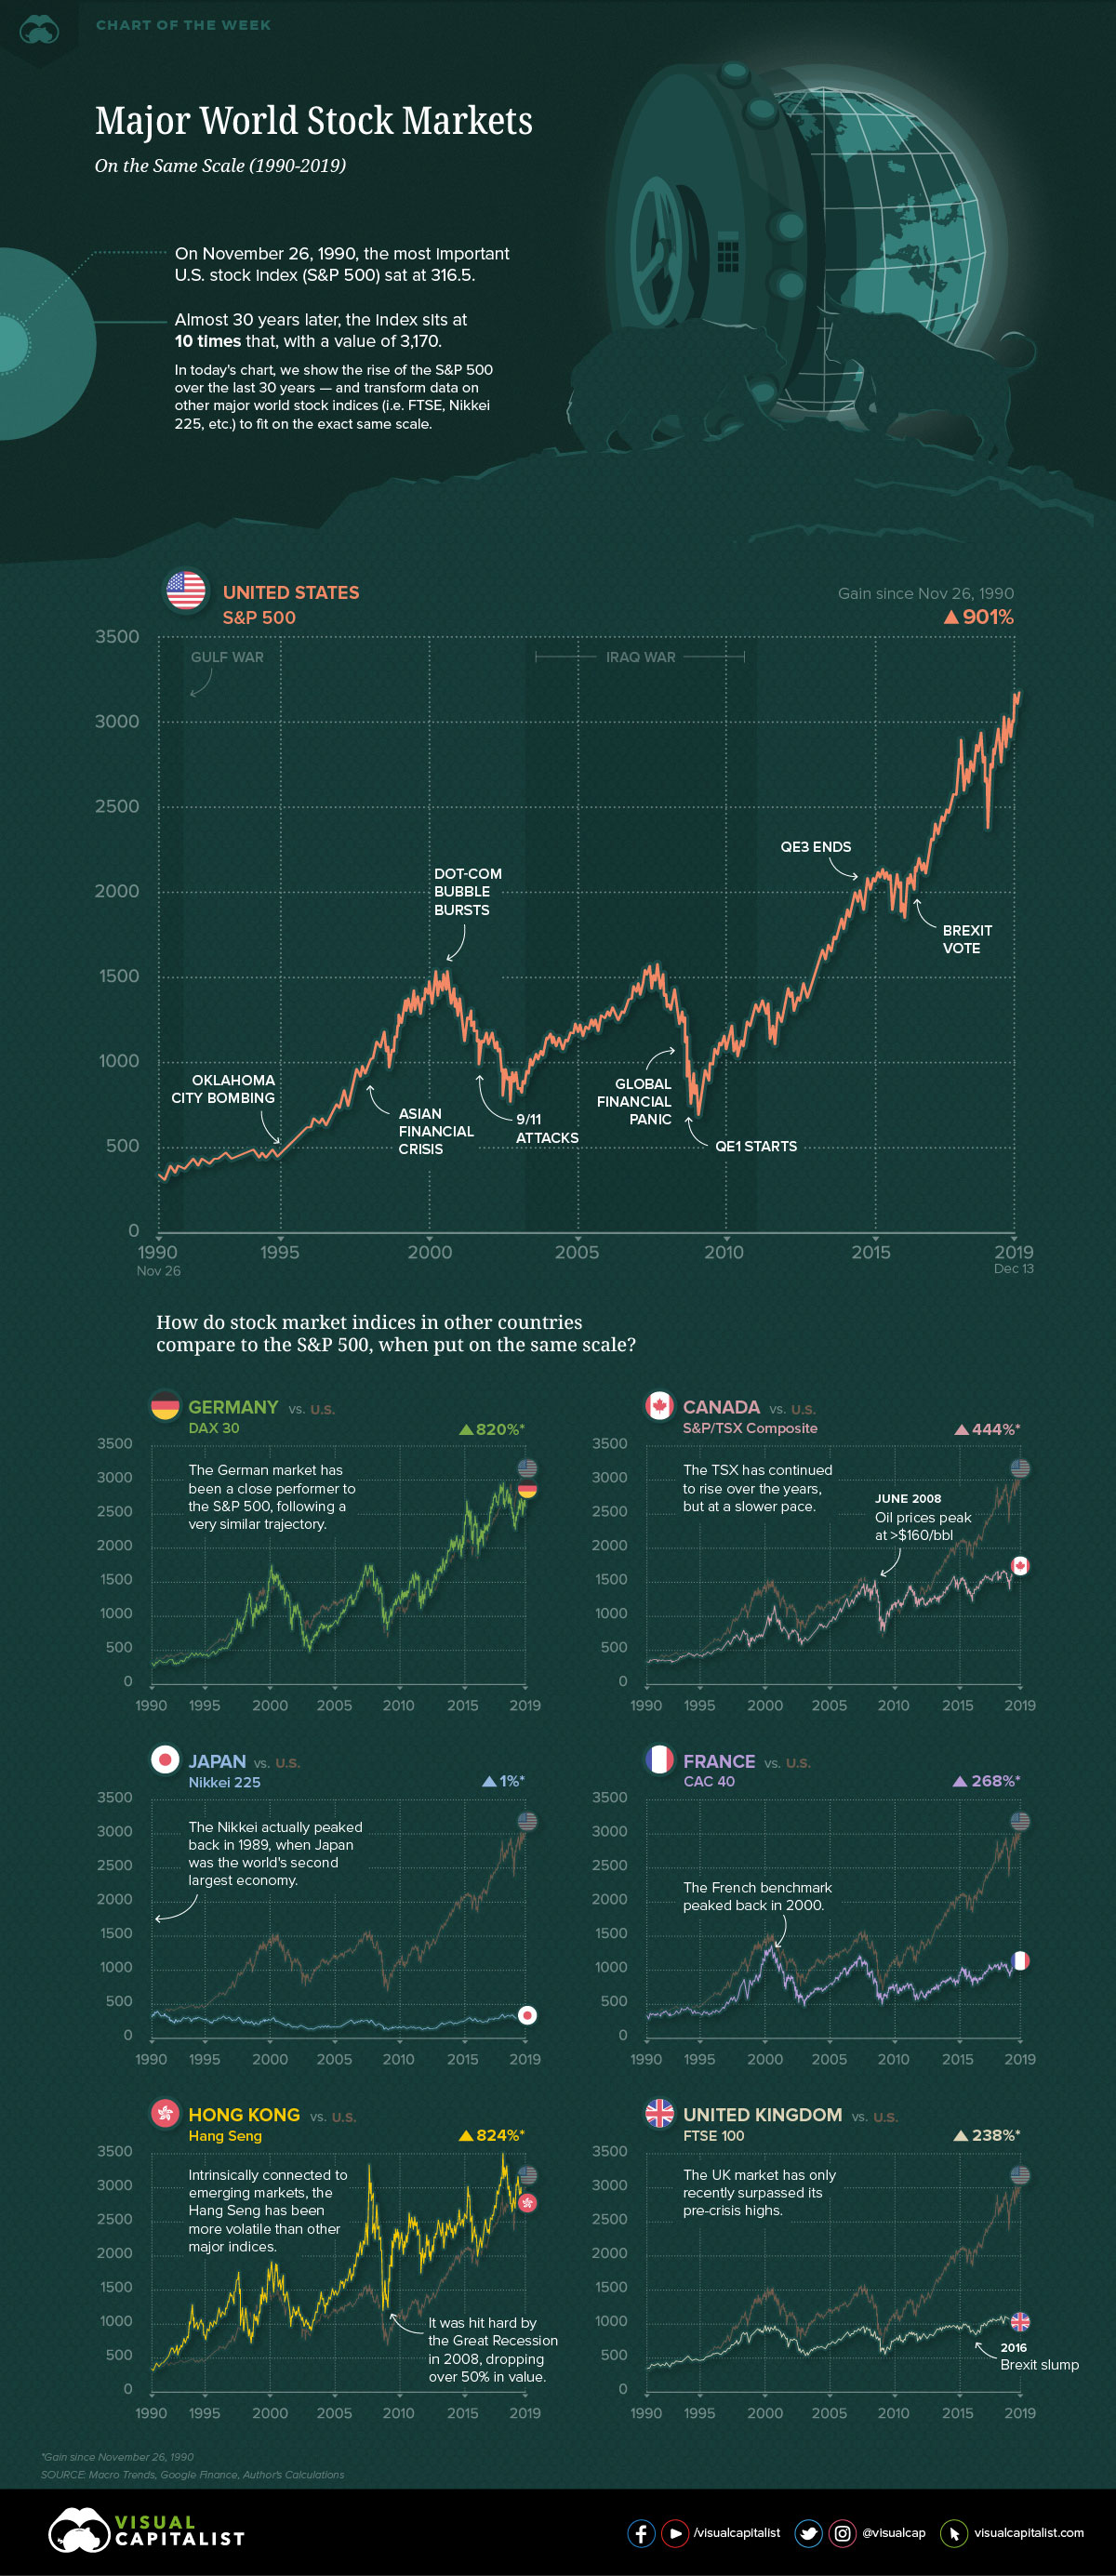
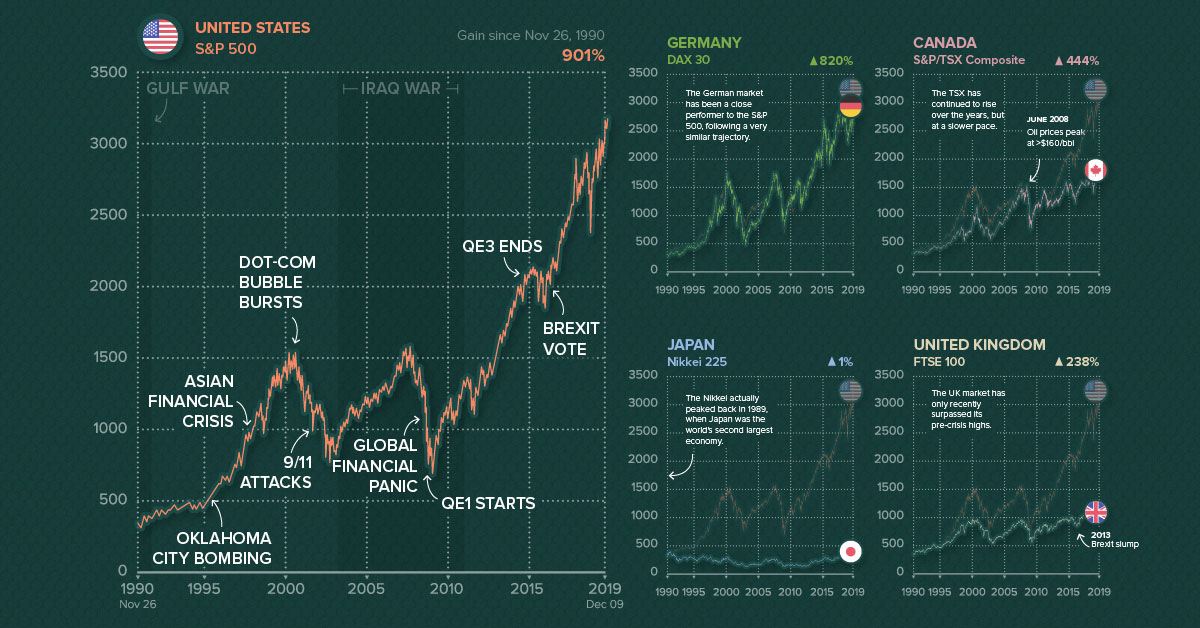
Most investors around the world are familiar with the S&P 500 index.
Not only is it the most widely accepted barometer of U.S. stock market performance, but it’s also been on a 10-year bull run, now sitting at all-time highs near 3,170.
This week, we chart those historical returns, and then use the U.S. benchmark as a backdrop to compare other major stock markets around the world, such as those in Europe, Asia, and Canada.
Putting Them All at Scale
One challenge in comparing global markets directly is that all indices are on arbitrary scales.
To directly compare them, the most natural option would be to transform the data to percentage terms. While that’s all fine and dandy, it’s also a little boring.
To make things more interesting, we’ve collected historical data that goes back nearly 30 years for each index. This was mostly done using Macrotrends, a fantastic resource for historical data. We used November 26th, 1990 as a cut-off date, since that was the earliest data point available for some of the country indices used.
We then transformed all of this data to be on the same scale of the S&P 500, so performance can be directly compared to the common American stock market benchmark.
Comparing Markets Using the S&P 500
Alright, now that we have the same scale for each market, let’s dive into the data:
| Country | Benchmark | Current Value (in S&P 500 terms) | Gain since Nov 26, 1990 |
|---|---|---|---|
| 🇺🇸 United States | S&P 500 | 3,168 | +901% |
| 🇭🇰 Hong Kong | Hang Seng Comp. | 2,926 | +824% |
| 🇩🇪 Germany | DAX 30 | 2,913 | +820% |
| 🇨🇦 Canada | S&P/TSX Comp. | 1,717 | +444% |
| 🇫🇷 France | CAC 40 | 1,160 | +268% |
| 🇬🇧 United Kingdom | FTSE 100 | 1,072 | +238% |
| 🇯🇵 Japan | Nikkei 225 | 315 | +1% |
Note: Data has been transformed to match the scale of the S&P 500, and is current as of December 13, 2019
If you invested $100 in the U.S. market on November 26, 1990, you’d have over $1,000 today.
Over nearly 30 years, the S&P 500 has increased by 901%, which is the most out any of these major indices. If you invested in the German or Hong Kong markets, you’d have fairly similar results as well — each gained more than 800% over the same time period.
Meanwhile, the markets in Canada, France, and the United Kingdom have all increased, but at a far slower pace:
- In S&P 500 terms, Canada would be sitting at 1,717 — which is where the U.S. market was back in 2013.
- France would be at 1,160, a mark the S&P 500 last hit in 2010.
- The United Kingdom would sit at 1,072, also equivalent to 2010 for the U.S. market.
Finally, in S&P 500 terms, the Japanese stock market would be at a lowly 315 points today — roughly where it started 30 years ago. In other words, if you had invested $100 in Japanese stocks in 1990, you’d have gained just $1 over a period of three decades.


Markets
U.S. Debt Interest Payments Reach $1 Trillion
U.S. debt interest payments have surged past the $1 trillion dollar mark, amid high interest rates and an ever-expanding debt burden.


U.S. Debt Interest Payments Reach $1 Trillion
This was originally posted on our Voronoi app. Download the app for free on iOS or Android and discover incredible data-driven charts from a variety of trusted sources.
The cost of paying for America’s national debt crossed the $1 trillion dollar mark in 2023, driven by high interest rates and a record $34 trillion mountain of debt.
Over the last decade, U.S. debt interest payments have more than doubled amid vast government spending during the pandemic crisis. As debt payments continue to soar, the Congressional Budget Office (CBO) reported that debt servicing costs surpassed defense spending for the first time ever this year.
This graphic shows the sharp rise in U.S. debt payments, based on data from the Federal Reserve.
A $1 Trillion Interest Bill, and Growing
Below, we show how U.S. debt interest payments have risen at a faster pace than at another time in modern history:
| Date | Interest Payments | U.S. National Debt |
|---|---|---|
| 2023 | $1.0T | $34.0T |
| 2022 | $830B | $31.4T |
| 2021 | $612B | $29.6T |
| 2020 | $518B | $27.7T |
| 2019 | $564B | $23.2T |
| 2018 | $571B | $22.0T |
| 2017 | $493B | $20.5T |
| 2016 | $460B | $20.0T |
| 2015 | $435B | $18.9T |
| 2014 | $442B | $18.1T |
| 2013 | $425B | $17.2T |
| 2012 | $417B | $16.4T |
| 2011 | $433B | $15.2T |
| 2010 | $400B | $14.0T |
| 2009 | $354B | $12.3T |
| 2008 | $380B | $10.7T |
| 2007 | $414B | $9.2T |
| 2006 | $387B | $8.7T |
| 2005 | $355B | $8.2T |
| 2004 | $318B | $7.6T |
| 2003 | $294B | $7.0T |
| 2002 | $298B | $6.4T |
| 2001 | $318B | $5.9T |
| 2000 | $353B | $5.7T |
| 1999 | $353B | $5.8T |
| 1998 | $360B | $5.6T |
| 1997 | $368B | $5.5T |
| 1996 | $362B | $5.3T |
| 1995 | $357B | $5.0T |
| 1994 | $334B | $4.8T |
| 1993 | $311B | $4.5T |
| 1992 | $306B | $4.2T |
| 1991 | $308B | $3.8T |
| 1990 | $298B | $3.4T |
| 1989 | $275B | $3.0T |
| 1988 | $254B | $2.7T |
| 1987 | $240B | $2.4T |
| 1986 | $225B | $2.2T |
| 1985 | $219B | $1.9T |
| 1984 | $205B | $1.7T |
| 1983 | $176B | $1.4T |
| 1982 | $157B | $1.2T |
| 1981 | $142B | $1.0T |
| 1980 | $113B | $930.2B |
| 1979 | $96B | $845.1B |
| 1978 | $84B | $789.2B |
| 1977 | $69B | $718.9B |
| 1976 | $61B | $653.5B |
| 1975 | $55B | $576.6B |
| 1974 | $50B | $492.7B |
| 1973 | $45B | $469.1B |
| 1972 | $39B | $448.5B |
| 1971 | $36B | $424.1B |
| 1970 | $35B | $389.2B |
| 1969 | $30B | $368.2B |
| 1968 | $25B | $358.0B |
| 1967 | $23B | $344.7B |
| 1966 | $21B | $329.3B |
Interest payments represent seasonally adjusted annual rate at the end of Q4.
At current rates, the U.S. national debt is growing by a remarkable $1 trillion about every 100 days, equal to roughly $3.6 trillion per year.
As the national debt has ballooned, debt payments even exceeded Medicaid outlays in 2023—one of the government’s largest expenditures. On average, the U.S. spent more than $2 billion per day on interest costs last year. Going further, the U.S. government is projected to spend a historic $12.4 trillion on interest payments over the next decade, averaging about $37,100 per American.
Exacerbating matters is that the U.S. is running a steep deficit, which stood at $1.1 trillion for the first six months of fiscal 2024. This has accelerated due to the 43% increase in debt servicing costs along with a $31 billion dollar increase in defense spending from a year earlier. Additionally, a $30 billion increase in funding for the Federal Deposit Insurance Corporation in light of the regional banking crisis last year was a major contributor to the deficit increase.
Overall, the CBO forecasts that roughly 75% of the federal deficit’s increase will be due to interest costs by 2034.

-

 Automotive2 weeks ago
Tesla Is Once Again the World’s Best-Selling EV Company
-

 AI1 week ago
The Stock Performance of U.S. Chipmakers So Far in 2024
-

 Automotive1 week ago
Almost Every EV Stock is Down After Q1 2024
-

 Money2 weeks ago
Where Does One U.S. Tax Dollar Go?
-

 Green2 weeks ago
Ranked: Top Countries by Total Forest Loss Since 2001
-

 Markets2 weeks ago
Visualizing America’s Shortage of Affordable Homes
-

 Maps2 weeks ago
Mapped: Average Wages Across Europe
-

 Mining2 weeks ago
Charted: The Value Gap Between the Gold Price and Gold Miners