Datastream
The Future Value of Disruptive Materials
The following content is sponsored by Global X ETFs
The Briefing
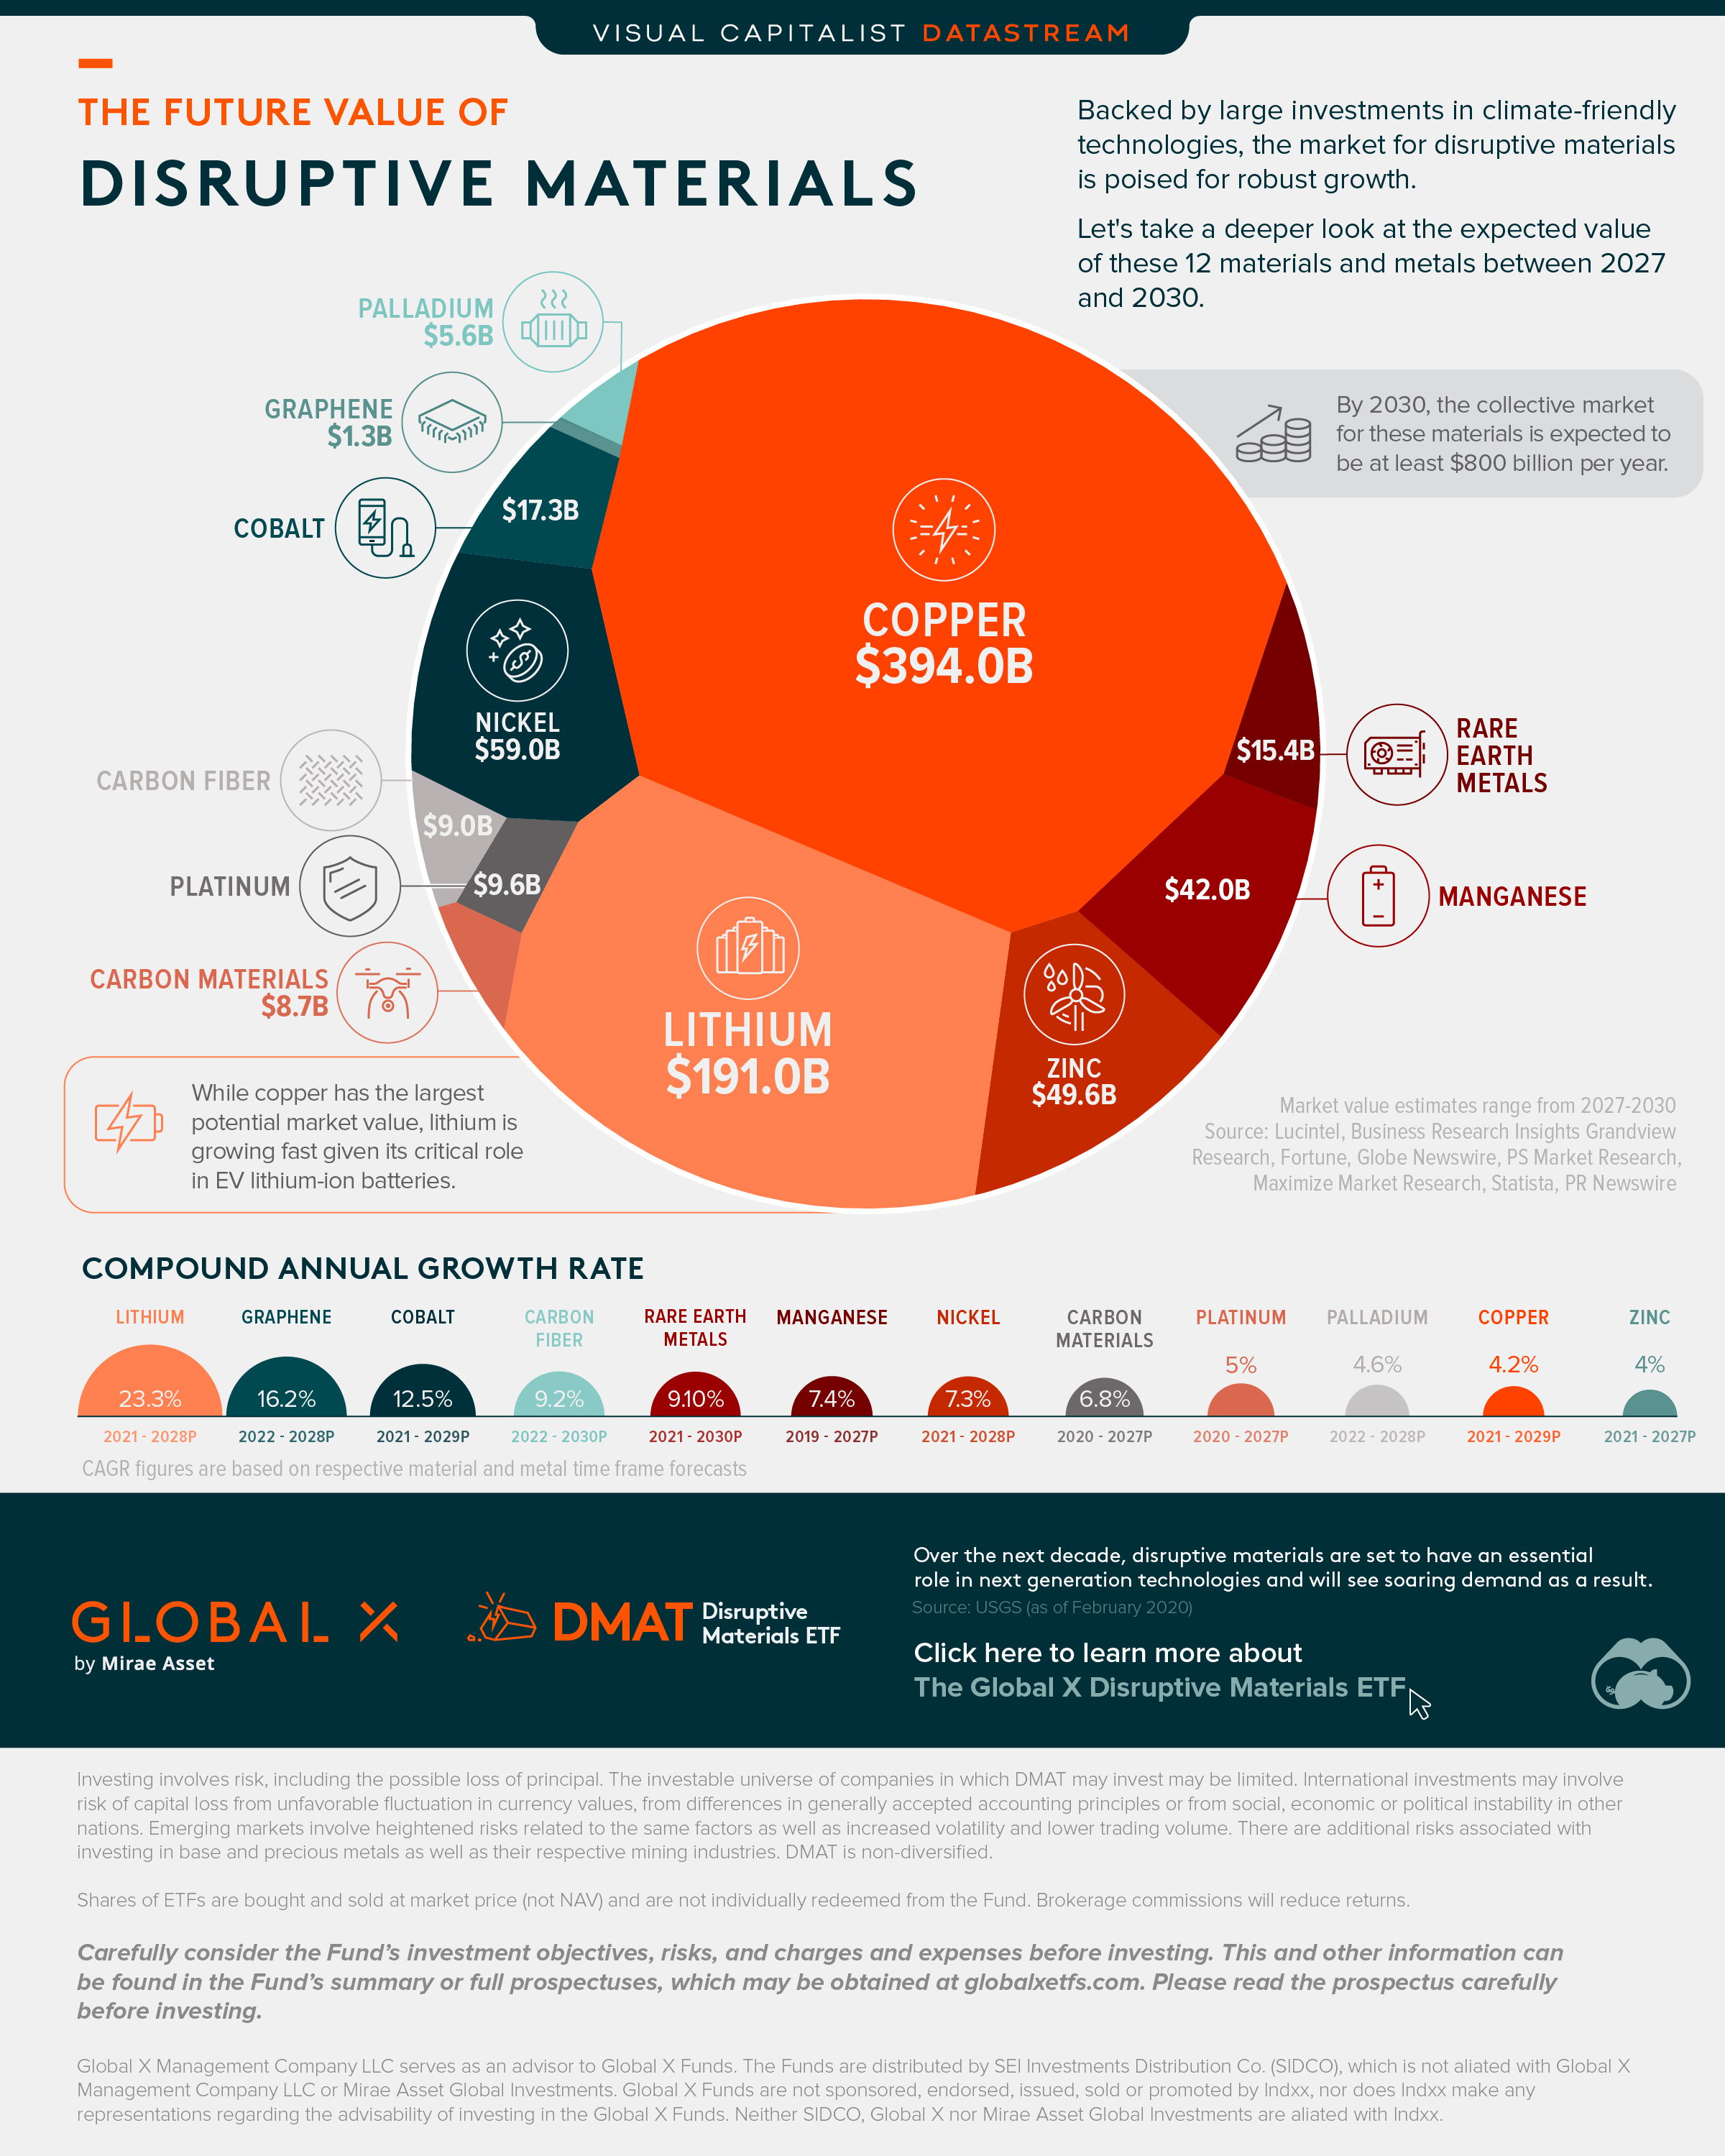
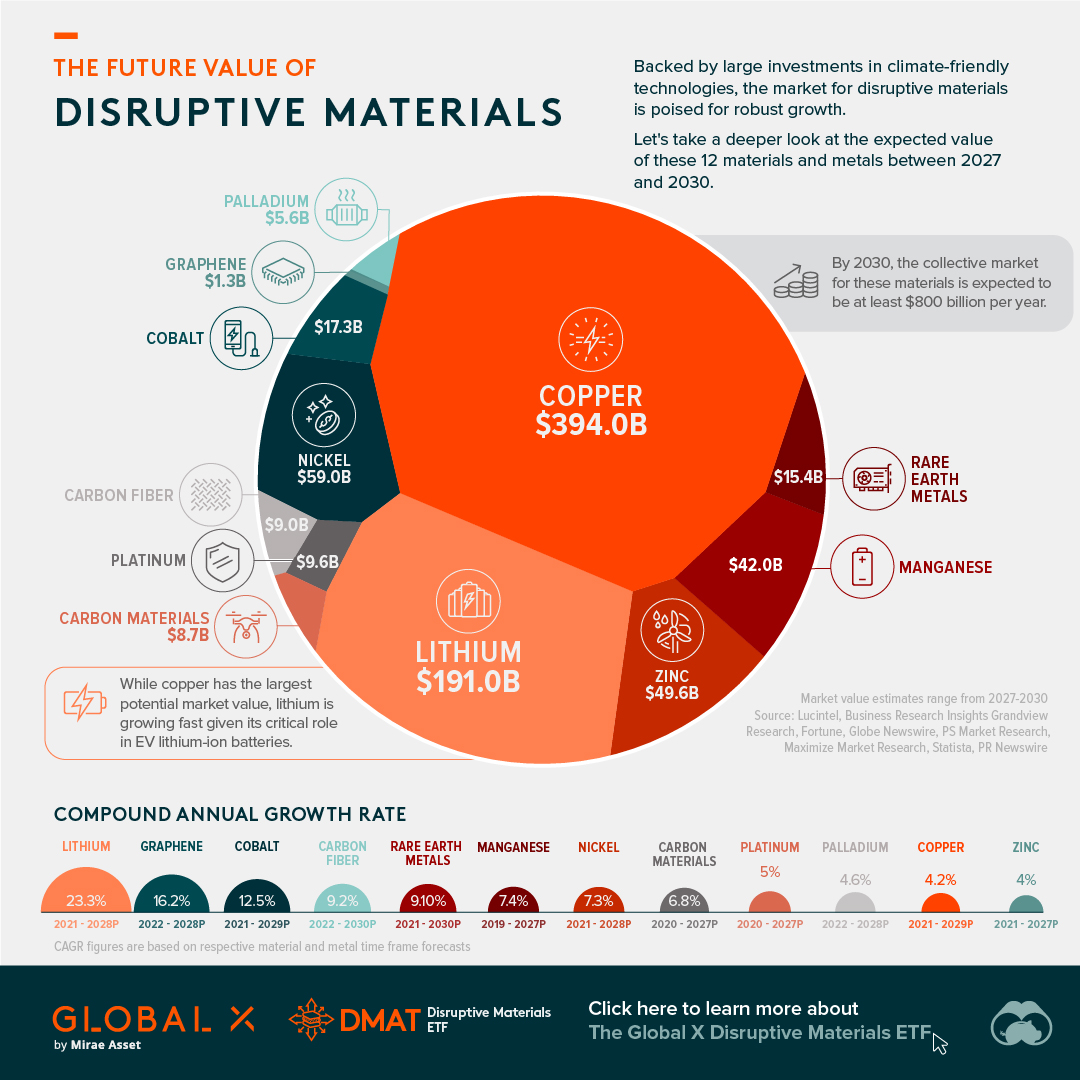
- By 2030, the collective market for disruptive materials is expected to reach over $800 billion
- Copper is the largest market while lithium is the fastest growing
The Future Value of Disruptive Materials
A select number of materials have a critical role to play in the expansion of next generation technologies. This could lead to a surge in demand and a potential soaring of market values for each material as a result.
This graphic from Global X ETFs takes a closer look at the forecasted market value for 12 disruptive materials, which are seeing increasingly large climate investment.
Soaring Market Values
The materials highlighted are each a billion dollar market in their own right. But which has the largest projected future market value?
Copper is one of the largest and most mature markets from this group. And as a result sees a lower projected compound annual growth rate (CAGR).
However, when it comes to the fastest growing market, lithium reigns supreme with a CAGR of over 23% between the forecast period of 2021 and 2028. Lithium is a vital ingredient for lithium-ion batteries, used in EVs and elsewhere.
| Disruptive Material | Projected Market Value ($B) | CAGR (over forecast period) |
|---|---|---|
| Copper | $394.0B by 2029 | 4.2% (2021-2029P) |
| Lithium | $191.0B by 2028 | 23.3% (2021-2028P) |
| Nickel | $59.0B by 2028 | 7.3% (2021-2028P) |
| Zinc | $49.6B by 2027 | 4.0% (2021-2027P) |
| Manganese | $42.0B by 2027 | 7.4% (2019-2027P) |
| Cobalt | $17.3B by 2029 | 12.5% (2021-2029P) |
| Rare Earth Metals | $15.4B by 2030 | 9.1% (2021-2030P) |
| Platinum | $9.6B by 2027 | 5.0% (2020-2027P) |
| Carbon Fiber | $9.0B by 2030 | 9.2% (2022-2030P) |
| Carbon Materials | $8.7B by 2027 | 6.8% (2020-2027P) |
| Palladium | $5.6B by 2028 | 4.6% (2022-2028P) |
| Graphene | $1.3B by 2028 | 16.2% (2022-2028P) |
Altogether, the collective market value for these top materials is expected to be worth over $800 billion by the end of the decade. And in the subsequent years, as efforts to tackle climate change accelerate, the collective value of these materials may well hit $1 trillion.
Introducing the Global X Disruptive Materials ETF
The Global X Disruptive Materials ETF (Ticker: DMAT) seeks to provide investment results that correspond generally to the price and yield performance, before fees and expenses, of the Solactive Disruptive Materials Index.
The Global X Disruptive Materials ETF is a passively managed solution that can be used to gain exposure to the rising demand for disruptive materials. Click the link to learn more.


Datastream
Can You Calculate Your Daily Carbon Footprint?
Discover how the average person’s carbon footprint impacts the environment and learn how carbon credits can offset your carbon footprint.


The Briefing
- A person’s carbon footprint is substantial, with activities such as food consumption creating as much as 4,500 g of CO₂ emissions daily.
- By purchasing carbon credits from Carbon Streaming Corporation, you can offset your own emissions and fund positive climate action.
Your Everyday Carbon Footprint
While many large businesses and countries have committed to net-zero goals, it is essential to acknowledge that your everyday activities also contribute to global emissions.
In this graphic, sponsored by Carbon Streaming Corporation, we will explore how the choices we make and the products we use have a profound impact on our carbon footprint.
Carbon Emissions by Activity
Here are some of the daily activities and products of the average person and their carbon footprint, according to Clever Carbon.
| Household Activities & Products | CO2 Emissions (g) |
|---|---|
| 💡 Standard Light Bulb (100 watts, four hours) | 172 g |
| 📱 Mobile Phone Use (195 minutes per day)* | 189 g |
| 👕 Washing Machine (0.63 kWh) | 275 g |
| 🔥 Electric Oven (1.56 kWh) | 675 g |
| ♨️ Tumble Dryer (2.5 kWh) | 1,000 g |
| 🧻 Toilet Roll (2 ply) | 1,300 g |
| 🚿 Hot Shower (10 mins) | 2,000 g |
| 🚙 Daily Commute (one hour, by car) | 3,360 g |
| 🍽️ Average Daily Food Consumption (three meals of 600 calories) | 4,500 g |
| *Phone use based on yearly use of 69kg per the source, Reboxed | |
Your choice of transportation plays a crucial role in determining your carbon footprint. For instance, a 15 km daily commute to work on public transport generates an average of 1,464 g of CO₂ emissions. Compared to 3,360 g—twice the volume for a journey the same length by car.
By opting for more sustainable modes of transport, such as cycling, walking, or public transportation, you can significantly reduce your carbon footprint.
Addressing Your Carbon Footprint
One way to compensate for your emissions is by purchasing high-quality carbon credits.
Carbon credits are used to help fund projects that avoid, reduce or remove CO₂ emissions. This includes nature-based solutions such as reforestation and improved forest management, or technology-based solutions such as the production of biochar and carbon capture and storage (CCS).
While carbon credits offer a potential solution for individuals to help reduce global emissions, public awareness remains a significant challenge. A BCG-Patch survey revealed that only 34% of U.S. consumers are familiar with carbon credits, and only 3% have purchased them in the past.
About Carbon Streaming
By financing the creation or expansion of carbon projects, Carbon Streaming Corporation secures the rights to future carbon credits generated by these sustainable projects. You can then purchase these carbon credits to help fund climate solutions around the world and compensate for your own emissions.
Ready to get involved?
>> Learn more about purchasing carbon credits at Carbon Streaming

-

 Education1 week ago
How Hard Is It to Get Into an Ivy League School?
-

 Technology2 weeks ago
Ranked: Semiconductor Companies by Industry Revenue Share
-

 Markets2 weeks ago
Ranked: The World’s Top Flight Routes, by Revenue
-

 Demographics2 weeks ago
Population Projections: The World’s 6 Largest Countries in 2075
-

 Markets2 weeks ago
The Top 10 States by Real GDP Growth in 2023
-

 Demographics2 weeks ago
The Smallest Gender Wage Gaps in OECD Countries
-

 Economy2 weeks ago
Where U.S. Inflation Hit the Hardest in March 2024
-

 Green2 weeks ago
Top Countries By Forest Growth Since 2001